In this article we will discuss the different aspects of motion such as distance, displacement, velocity, etc. and how to comprehend these characteristics through graphs.
Position
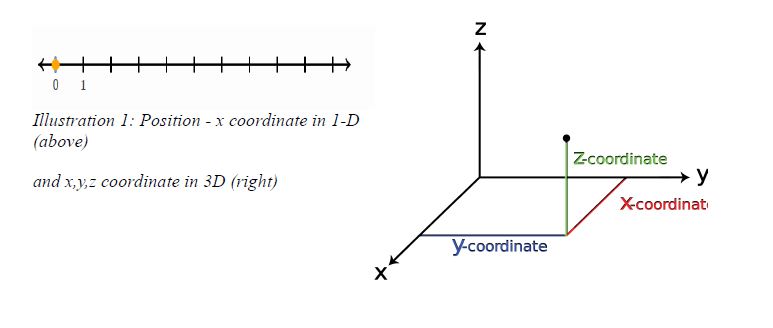
Position is simply the location of the particle or body. In Cartesian coordinate system, the position is given by the (x, y, z) co-ordinates.
For 1-Dimension only x-coordinate is enough.
Distance and displacement
Distance – distance is simply the total length covered while traveling from one position to the other in a given time. It is a scalar quantity.
Distance is measured in meters.
Example 1: Suppose a car travels 200m west and then 100m east. What is the total distance traveled?
ANS – we simply add the distance moved.
i.e. 200m + 100m = 300m
So total distance is 300m
It is a scalar quantity.
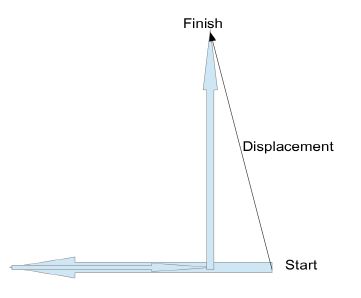
Example 2: If a person travels 7m west, then 4m east and then 4m north, what is the distance traveled?
ANS- distance as we discussed is just the total
movement. So we just add 7m+4m+4m = 15m.
So total distance traveled is 15m
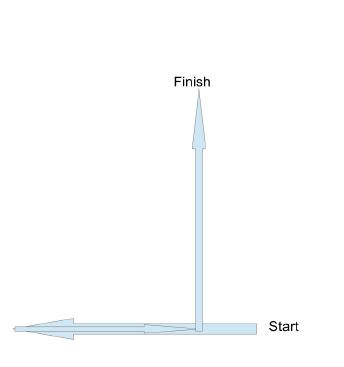
Displacement – Displacement is a vector. It gives the net change in position along with the direction of total movement.
• In 1-Dimension we can calculate the displacement by simply subtracting the starting coordinate from the finishing co-ordinate. This quantity is sometimes expressed as ?x, i.e. final x coordinate – initial x coordinate => x1-x0 = ?x [? is used to denote difference]
• Say we go back to example 1. If the car goes 200m west and then
comes back 100m east, then the net difference in position between starting and finishing points would be 100m. Displacement would be 100m towards west.

• Now lets go back to Example 2, we saw for distance. Although the distance traveled was 15m(as seen in the example in the previous
section), the displacement is the difference between starting point and the finishing point. The displacement thus cannot be calculated like
distance. We have to use the Pythagorean theorem.
Displacement :
[(7-4)²+4²](1/2) m = (3²+4²)^(1/2) m = 5m and since it is a vector, there is a direction associated with it. The black arrow in the diagram points towards the direction of displacement i.e. North-West
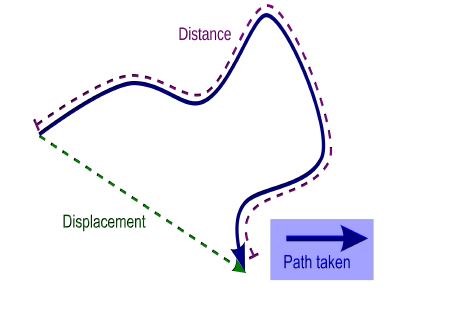
Another diagram to help understand the difference between distance and displacement is given below.
Average speed and Average velocity
Average speed : average speed is the total distance traveled divided by the total time taken to cover the distance.
- It is a scalar quantity. The units used are meter per seconds.
- Average speed is generally denoted by v
- v = x/t
Where x – distance traveled
and t – time taken
- Eg: lets say a women walks 300m to the north in 5mins. But then has to walk back south for 50m, which she covers in 50sec. Find her average speed in m/s.
ANS – total distance traveled is 300m + 50m = 350m
now 5mins = 5 x 60sec = 300sec
total time taken = 300s + 50s = 350s
average velocity = v = 350m/350s = 1m/s
Average velocity : average velocity is the displacement divided by the time taken to move from starting point to the finishing point.
- It is a vector quantity and has direction.
- It is also denoted by v . (so we must be careful and generally make it explicitly clear whether the v is avg. speed or avg. velocity)
- v = (x1-x0) / t = ?x/t,
where x1-x0 = ?x is the displacement
and t = time taken
- Thus it can be clearly inferred from this equation that the direction of average velocity is the direction of displacement.
- Eg: lets take the same example we considered for average speed and calculate the average velocity.
If the woman walks north 300m and then walks 50m back south, then displacement is 250m. Now time taken is 350s .
So average velocity = 250m/350s = 0.714m/s
Acceleration
Acceleration is the change in velocity divided by the time taken.
- Change in velocity is denoted by vf-vi = ?v
Where vf denotes final velocity
and vi denotes initial velocity.
- Acceleration is often denoted by ‘a’
- So acceleration, a = ?v/t
- Acceleration is also a vector quantity. Acceleration is measured in (m/s)/s or m/s2
- Lets see a small problem. Lets say a new car has come to the market which can hit a speed of 70m/s from being stationary (0m/s) in just 7 seconds. What is its acceleration, when the car performs this feat?
ANS – final velocity = 70m/s
initial velocity = 0m/s
So, change in velocity = ?v = 70m/s – 0m/s = 70m/s
time taken = t = 7s
a = ?v/t = (70m/s)/(7s) = 10m/s2
Average and Instantenous quantities
- Average values are calculated over a period of time.
- Instantenous values give the rate of change at that particular instant of time at that position.
Thus they are not the same values all the time.
- Lets see this with an example. Suppose there is a straight track of length 400m. An athlete runs the first 100m of the race in 12s with constant velocity. The next 200m she covers in 30s in constant velocity and the last 100m she runs in 10s, again with constant velocity. What would be her average velocity for the whole race? What would be maximum and minimun instantenous velocity?
ANS – her displacement is 400m.
Total time taken is 12s+30s+10s = 52s
so avg. velocity = 400m/52s = 7.69m/s
velocity for the first 100 meters = 100m/12s = 8.33m/s
velocity for the next 200 meters = 200m/30s = 6.67m/s
velocity for the final 100 meters = 100m/10s = 10m/s
So, we see maximum instantenous velocity =10m/s
and minimun instantenous velocity = 6.67m/s
Position-time graph
- The position time graph simply plots the position (or displacement) of the object in vertical-axis and time in horizontal-axis. (In most of the our analysis, time is always denoted by the horizontal axis)
These are also known as x-t graph, where ‘x’ denotes position and ‘t’ denotes times.
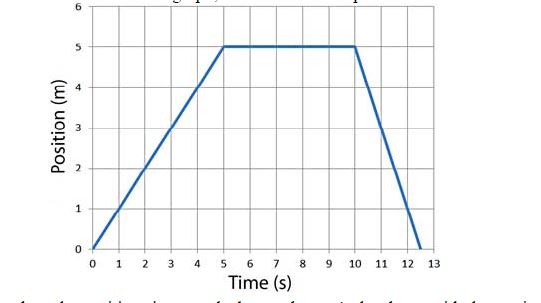
Lets analyse the position-time graph shown above. As has been said, the vertical-axis shows position (displacement) and horizontal-axis shows time.
- For t=1s, position is at 1m
- For t=2s, position is at 2m
- For t=3s, position is at 3m
So, we can see that displacement increases upto time = 5s.
- From t=5s to t=10s we can see that position is constant at 5m. So there is no movement.
- From t=10s to around t=12.5s , the position retraces back to the object’s original position and hence displacement keeps reducing, until it is zero.
- Slope
- The slope of the graph is given by change in position divided by time interval. Change in position is displacement. So slope is displacement divided by time.
- Velocity = displacement / time
- Thus slope of position-time graph gives velocity.
- If we analyze the above graph for velocity we can see that from t=0 to t=5 change in position is 5m-0m = 5m
So, calculating slope, velocity is: (5-0)m / (5-0)s = 1m/s
- From t=5 to t=10, there is no change in position so displacement and hence velocity is also zero.
- From t=10 to t=12.5 is interesting. Change in position is 0-5 = -5m and time interval is 12.5s-10s = 2.5s.
So velocity is : -5m/2.5s = -10m/s
- What does negative velocity imply? It simply shows that velocity is in opposite direction.
Velocity-time graph
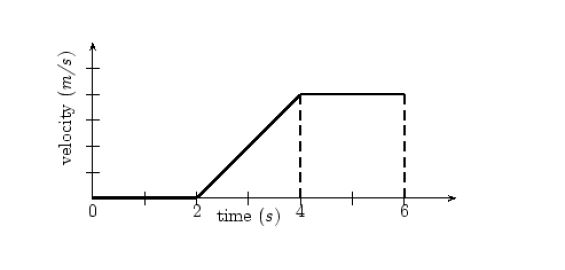
Now lets see velocity time graphs. In these graphs, the vertical axis gives velocity and horizontal-axis gives time as usual. These are known as v-t graphs.
Velocity
- Lets see the above graph. Upto t=2s the velocity is actually 0m/s. So the object is stationary and there is no movement.
- From t=2s to t=4s the velocity of the object steadily increases from 0m/s to 4m/s (we can count each mark in the velocity axis as an increase of 1m/s)
- From t=4s to t=6s the velocity is constant at 4m/s
- Area
- velocity = displacement / time interval
which means that displacement = velocity x time interval
- Now if we see the third region where velocity is constant at 4m/s, the area of the rectangular region is given by height multiplied by base, which in this case turns out to be velocity multiplied by time interval.
Now velocity x time interval = displacement
- Thus we can get an intuitive idea how the area under velocity-time graph gives us the change in position or displacement of the object.
- Velocity = 4m/s and time interval = 6-4=2s
So area = 4m/s x 2s = 8m
so the displacement of the object from t=4s to t=6s is 8 meters.
- Similarly we can calculate the displacement that takes place between t=2s to t=4s
- height = 4m/s
- base = 4s-2s = 2s
- area of triangle = (½) x base x height = (½) x 2s x 4m/s = 4m
So displacement is 4 meters.
- Slope
- What does the slope of v-t graph give us?
- Slope of a v-t graph is given by change in velocity divided by time interval. This as we also know is the defination of acceleration.
- So slope of v-t graph gives us acceleration.
- We can see there is a change in velocity from t=2s to t=4s.
Change in velocity is: 4m/s – 0m/s = 4m/s
time interval is: 4s-2s = 2s
So slope : (4m/s) / (2s) = 2m/s2
Hence acceleration = 2m/s2.
Acceleration time graph
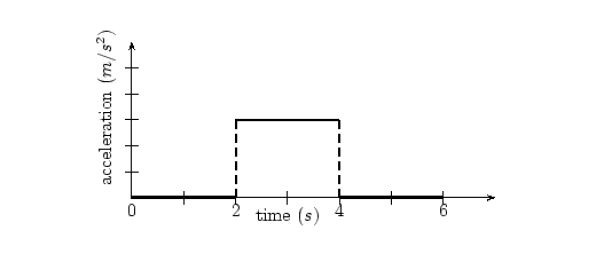
The above is a simple acceleration-time graph. The acceleration is on the vertical axis and time on the horizontal axis.
- Area
The area under the acceleration-time graph gives us the change in velocity.
So we can see for the time interval from t=2s to t=4s acceleration is non-zero, which means velocity is changing. Lets see by how much.
Area = acceleration x time interval = 3m/s2 x 2s = 6m/s
So we can say that velocity increased by 6m/s from t=2s to t=4s.
If an object is moving with constant velocity, this is what its graphs would look like:
Important Points
- Slope of position-time graph gives velocity.
- Slope of velocity-time graph gives acceleration.
- Area under velocity-time graph gives change in position or displacement.
- Area under acceleration-time graph gives change in velocity.
[box type=”success” align=”” class=”” width=””]For more examples check out some of the lessons in our AP Physics 1 & 2 course. We cover topics such as Defining and Graphing Motion.[/box]


