Table of Contents
Section 1: Power BI Fundamentals
Overview of Power BI Course
1m 46s
Power BI Intro
3m 26s
Power BI High Level Flow
2m 20s
Install and Sign Up
2m 44s
Power Query Intro
4m 43s
Power Pivot Intro
1m 8s
Power View Intro
1m 34s
Big Picture
1m 40s
Get Data
6m 43s
How to Get More Data
1m 4s
Modelling Data
3m
Adding Relationships Manually
2m 7s
Visualization
4m 35s
Visualization Customization
1m 25s
More Visualizations
2m 24s
Visualization Format and Analytics
2m 56s
Ask a Question
2m 8s
Section 2: Power BI Real World Example
Real World Example
5m 44s
Get Data
13m 3s
Modelling Data
5m 6s
Visualization with multiple charts
11m 14s
Publishing
4m 34s
Power BI Website
8m 22s
Loading...
This is a quick preview of the lesson. For full access, please Log In or Sign up.
For more information, please see full course syllabus of Microsoft Power BI
For more information, please see full course syllabus of Microsoft Power BI
Microsoft Power BI More Visualizations
Section 1: Power BI Fundamentals: Lecture 15 | 2:24 min
Lecture Description
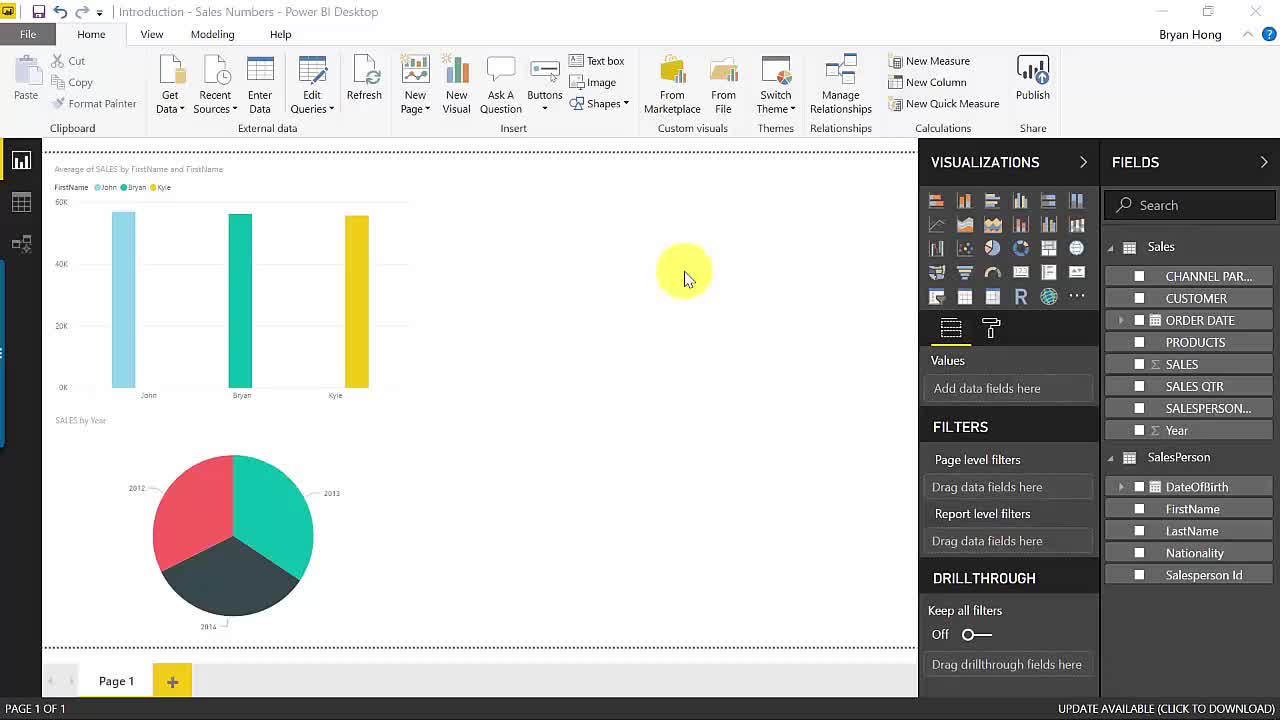
More ways to visualize your data
Bookmark & Share
Embed
Share this knowledge with your friends!
Copy & Paste this embed code into your website’s HTML
Please ensure that your website editor is in text mode when you paste the code.(In Wordpress, the mode button is on the top right corner.)
×
Since this lesson is not free, only the preview will appear on your website.
- - Allow users to view the embedded video in full-size.
Next Lecture
Previous Lecture


Start Learning Now
Our free lessons will get you started (Adobe Flash® required).
Sign up for Educator.comGet immediate access to our entire library.
Membership Overview