


 Carleen Eaton
 Grant Fraser
Connecting...

This is a quick preview of the lesson. For full access, please Log In or Sign up.
For more information, please see full course syllabus of Algebra 2
For more information, please see full course syllabus of Algebra 2
Share this knowledge with your friends!

Copy & Paste this embed code into your website’s HTML
Please ensure that your website editor is in text mode when you paste the code.(In Wordpress, the mode button is on the top right corner.)
×
Since this lesson is not free, only the preview will appear on your website.
- - Allow users to view the embedded video in full-size.
 Answer Engine


1 answer
Fri Jun 8, 2018 11:42 PM
Post by Krishna vempati on June 8, 2018
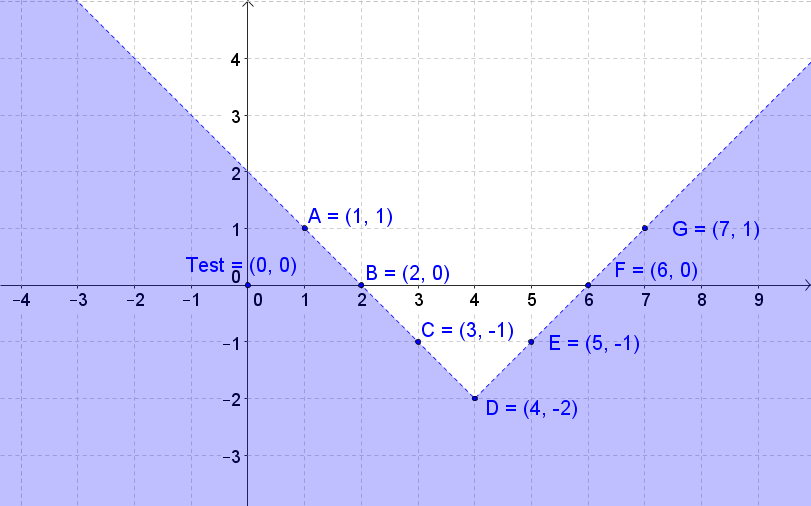
At about 3:19 into the lecture one of the coordinate points was incorrectly graphed at (1,0) rather than (1,1). I am really enjoying your course program. Thanks,
1 answer
Last reply by: Magdy Mettias
Sun Sep 23, 2012 3:35 PM
Post by Nancy Dempsey on March 18, 2011
Thanks
0 answers
Post by Jeff Mitchell on March 5, 2011
At about 3:19 into the lecture one of the coordinate points was incorrectly graphed at (1,0) rather than (1,1). I am really enjoying your course program. Thanks,