INSTRUCTORS Carleen Eaton Grant Fraser

Dr. Carleen Eaton

Dr. Carleen Eaton

Graphing Rational Functions

Slide Duration:

Table of Contents

Section 1: Equations and Inequalities
Expressions and Formulas

22m 23s

Intro
0:00
Order of Operations
0:19
Variable
0:27
Algebraic Expression
0:46
Term
0:57
Example: Algebraic Expression
1:25
Evaluate Inside Grouping Symbols
1:55
Evaluate Powers
2:30
Multiply/Divide Left to Right
2:55
Add/Subtract Left to Right
3:35
Monomials
4:40
Examples of Monomials
4:52
Constant
5:27
Coefficient
5:46
Degree
6:25
Power
7:15
Polynomials
8:02
Examples of Polynomials
8:24
Binomials, Trinomials, Monomials
8:53
Term
9:21
Like Terms
10:02
Formulas
11:00
Example: Pythagorean Theorem
11:15
Example 1: Evaluate the Algebraic Expression
11:50
Example 2: Evaluate the Algebraic Expression
14:38
Example 3: Area of a Triangle
19:11
Example 4: Fahrenheit to Celsius
20:41
Properties of Real Numbers

20m 15s

Intro
0:00
Real Numbers
0:07
Number Line
0:15
Rational Numbers
0:46
Irrational Numbers
2:24
Venn Diagram of Real Numbers
4:03
Irrational Numbers
5:00
Rational Numbers
5:19
Real Number System
5:27
Natural Numbers
5:32
Whole Numbers
5:53
Integers
6:19
Fractions
6:46
Properties of Real Numbers
7:15
Commutative Property
7:34
Associative Property
8:07
Identity Property
9:04
Inverse Property
9:53
Distributive Property
11:03
Example 1: What Set of Numbers?
12:21
Example 2: What Properties Are Used?
13:56
Example 3: Multiplicative Inverse
16:00
Example 4: Simplify Using Properties
17:18
Solving Equations

19m 10s

Intro
0:00
Translations
0:06
Verbal Expressions and Algebraic Expressions
0:13
Example: Sum of Two Numbers
0:19
Example: Square of a Number
1:33
Properties of Equality
3:20
Reflexive Property
3:30
Symmetric Property
3:42
Transitive Property
4:01
Addition Property
5:01
Subtraction Property
5:37
Multiplication Property
6:02
Division Property
6:30
Solving Equations
6:58
Example: Using Properties
7:18
Solving for a Variable
8:25
Example: Solve for Z
8:34
Example 1: Write Algebraic Expression
10:15
Example 2: Write Verbal Expression
11:31
Example 3: Solve the Equation
14:05
Example 4: Simplify Using Properties
17:26
Solving Absolute Value Equations

17m 31s

Intro
0:00
Absolute Value Expressions
0:09
Distance from Zero
0:18
Example: Absolute Value Expression
0:24
Absolute Value Equations
1:50
Example: Absolute Value Equation
2:00
Example: Isolate Expression
3:13
No Solution
3:46
Empty Set
3:58
Example: No Solution
4:12
Number of Solutions
4:46
Check Each Solution
4:57
Example: Two Solutions
5:05
Example: No Solution
6:18
Example: One Solution
6:28
Example 1: Evaluate for X
7:16
Example 2: Write Verbal Expression
9:08
Example 3: Solve the Equation
12:18
Example 4: Simplify Using Properties
13:36
Solving Inequalities

17m 14s

Intro
0:00
Properties of Inequalities
0:08
Addition Property
0:17
Example: Using Numbers
0:30
Subtraction Property
1:03
Example: Using Numbers
1:19
Multiplication Properties
1:44
C>0 (Positive Number)
1:50
Example: Using Numbers
2:05
C<0 (Negative Number)
2:40
Example: Using Numbers
3:10
Division Properties
4:11
C>0 (Positive Number)
4:15
Example: Using Numbers
4:27
C<0 (Negative Number)
5:21
Example: Using Numbers
5:32
Describing the Solution Set
6:10
Example: Set Builder Notation
6:26
Example: Graph (Closed Circle)
7:08
Example: Graph (Open Circle)
7:30
Example 1: Solve the Inequality
7:58
Example 2: Solve the Inequality
9:06
Example 3: Solve the Inequality
10:10
Example 4: Solve the Inequality
13:12
Solving Compound and Absolute Value Inequalities

25m

Intro
0:00
Compound Inequalities
0:08
And and Or
0:13
Example: And
0:22
Example: Or
1:12
And Inequality
1:41
Intersection
1:49
Example: Numbers
2:08
Example: Inequality
2:43
Or Inequality
4:35
Example: Union
4:45
Example: Inequality
5:53
Absolute Value Inequalities
7:19
Definition of Absolute Value
7:33
Examples: Compound Inequalities
8:30
Example: Complex Inequality
12:21
Example 1: Solve the Inequality
12:54
Example 2: Solve the Inequality
17:21
Example 3: Solve the Inequality
18:54
Example 4: Solve the Inequality
22:15
Section 2: Linear Relations and Functions
Relations and Functions

32m 5s

Intro
0:00
Coordinate Plane
0:20
X-Coordinate and Y-Coordinate
0:30
Example: Coordinate Pairs
0:37
Quadrants
1:20
Relations
2:14
Domain and Range
2:19
Set of Ordered Pairs
2:29
As a Table
2:51
Functions
4:21
One Element in Range
4:32
Example: Mapping
4:43
Example: Table and Map
6:26
One-to-One Functions
8:01
Example: One-to-One
8:22
Example: Not One-to-One
9:18
Graphs of Relations
11:01
Discrete and Continuous
11:12
Example: Discrete
11:22
Example: Continous
12:30
Vertical Line Test
14:09
Example: S Curve
14:29
Example: Function
16:15
Equations, Relations, and Functions
17:03
Independent Variable and Dependent Variable
17:16
Function Notation
19:11
Example: Function Notation
19:23
Example 1: Domain and Range
20:51
Example 2: Discrete or Continous
23:03
Example 3: Discrete or Continous
25:53
Example 4: Function Notation
30:05
Linear Equations

14m 46s

Intro
0:00
Linear Equations and Functions
0:07
Linear Equation
0:19
Example: Linear Equation
0:29
Example: Linear Function
1:07
Standard Form
2:02
Integer Constants with No Common Factor
2:08
Example: Standard Form
2:27
Graphing with Intercepts
4:05
X-Intercept and Y-Intercept
4:12
Example: Intercepts
4:26
Example: Graphing
5:14
Example 1: Linear Function
7:53
Example 2: Linear Function
9:10
Example 3: Standard Form
10:04
Example 4: Graph with Intercepts
12:25
Slope

23m 7s

Intro
0:00
Definition of Slope
0:07
Change in Y / Change in X
0:26
Example: Slope of Graph
0:37
Interpretation of Slope
3:07
Horizontal Line (0 Slope)
3:13
Vertical Line (Undefined Slope)
4:52
Rises to Right (Positive Slope)
6:36
Falls to Right (Negative Slope)
6:53
Parallel Lines
7:18
Example: Not Vertical
7:30
Example: Vertical
7:58
Perpendicular Lines
8:31
Example: Perpendicular
8:42
Example 1: Slope of Line
10:32
Example 2: Graph Line
11:45
Example 3: Parallel to Graph
13:37
Example 4: Perpendicular to Graph
17:57
Writing Linear Functions

23m 5s

Intro
0:00
Slope Intercept Form
0:11
m and b
0:28
Example: Graph Using Slope Intercept
0:43
Point Slope Form
2:41
Relation to Slope Formula
3:03
Example: Point Slope Form
4:36
Parallel and Perpendicular Lines
6:28
Review of Parallel and Perpendicular Lines
6:31
Example: Parallel
7:50
Example: Perpendicular
9:58
Example 1: Slope Intercept Form
11:07
Example 2: Slope Intercept Form
13:07
Example 3: Parallel
15:49
Example 4: Perpendicular
18:42
Special Functions

31m 5s

Intro
0:00
Step Functions
0:07
Example: Apple Prices
0:30
Absolute Value Function
4:55
Example: Absolute Value
5:05
Piecewise Functions
9:08
Example: Piecewise
9:27
Example 1: Absolute Value Function
14:00
Example 2: Absolute Value Function
20:39
Example 3: Piecewise Function
22:26
Example 4: Step Function
25:25
Graphing Inequalities

21m 42s

Intro
0:00
Graphing Linear Inequalities
0:07
Shaded Region
0:19
Using Test Points
0:32
Graph Corresponding Linear Function
0:46
Dashed or Solid Lines
0:59
Use Test Point
1:21
Example: Linear Inequality
1:58
Graphing Absolute Value Inequalities
4:50
Graph Corresponding Equations
4:59
Use Test Point
5:20
Example: Absolute Value Inequality
5:38
Example 1: Linear Inequality
9:17
Example 2: Linear Inequality
11:56
Example 3: Linear Inequality
14:29
Example 4: Absolute Value Inequality
17:06
Section 3: Systems of Equations and Inequalities
Solving Systems of Equations by Graphing

17m 13s

Intro
0:00
Systems of Equations
0:09
Example: Two Equations
0:24
Solving by Graphing
0:53
Point of Intersection
1:09
Types of Systems
2:29
Independent (Single Solution)
2:34
Dependent (Infinite Solutions)
3:05
Inconsistent (No Solution)
4:23
Example 1: Solve by Graphing
5:20
Example 2: Solve by Graphing
9:10
Example 3: Solve by Graphing
12:27
Example 4: Solve by Graphing
14:54
Solving Systems of Equations Algebraically

23m 53s

Intro
0:00
Solving by Substitution
0:08
Example: System of Equations
0:36
Solving by Multiplication
7:22
Extra Step of Multiplying
7:38
Example: System of Equations
8:00
Inconsistent and Dependent Systems
11:14
Variables Drop Out
11:48
Inconsistent System (Never True)
12:01
Constant Equals Constant
12:53
Dependent System (Always True)
13:11
Example 1: Solve Algebraically
13:58
Example 2: Solve Algebraically
15:52
Example 3: Solve Algebraically
17:54
Example 4: Solve Algebraically
21:40
Solving Systems of Inequalities By Graphing

27m 12s

Intro
0:00
Solving by Graphing
0:08
Graph Each Inequality
0:25
Overlap
0:35
Corresponding Linear Equations
1:03
Test Point
1:23
Example: System of Inequalities
1:51
No Solution
7:06
Empty Set
7:26
Example: No Solution
7:34
Example 1: Solve by Graphing
10:27
Example 2: Solve by Graphing
13:30
Example 3: Solve by Graphing
17:19
Example 4: Solve by Graphing
23:23
Solving Systems of Equations in Three Variables

28m 53s

Intro
0:00
Solving Systems in Three Variables
0:17
Triple of Values
0:31
Example: Three Variables
0:56
Number of Solutions
5:55
One Solution
6:08
No Solution
6:24
Infinite Solutions
7:06
Example 1: Solve 3 Variables
7:59
Example 2: Solve 3 Variables
13:50
Example 3: Solve 3 Variables
19:54
Example 4: Solve 3 Variables
25:50
Section 4: Matrices
Basic Matrix Concepts

11m 34s

Intro
0:00
What is a Matrix
0:26
Brackets
0:46
Designation
1:21
Element
1:47
Matrix Equations
1:59
Dimensions
2:27
Rows (m) and Columns (n)
2:37
Examples: Dimensions
2:43
Special Matrices
4:22
Row Matrix
4:32
Column Matrix
5:00
Zero Matrix
6:00
Equal Matrices
6:30
Example: Corresponding Elements
6:36
Example 1: Matrix Dimension
8:12
Example 2: Matrix Dimension
9:03
Example 3: Zero Matrix
9:38
Example 4: Row and Column Matrix
10:26
Matrix Operations

21m 36s

Intro
0:00
Matrix Addition
0:18
Same Dimensions
0:25
Example: Adding Matrices
1:04
Matrix Subtraction
3:42
Same Dimensions
3:48
Example: Subtracting Matrices
4:04
Scalar Multiplication
6:08
Scalar Constant
6:24
Example: Multiplying Matrices
6:32
Properties of Matrix Operations
8:23
Commutative Property
8:41
Associative Property
9:08
Distributive Property
9:44
Example 1: Matrix Addition
10:24
Example 2: Matrix Subtraction
11:58
Example 3: Scalar Multiplication
14:23
Example 4: Matrix Properties
16:09
Matrix Multiplication

29m 36s

Intro
0:00
Dimension Requirement
0:17
n = p
0:24
Resulting Product Matrix (m x q)
1:21
Example: Multiplication
1:54
Matrix Multiplication
3:38
Example: Matrix Multiplication
4:07
Properties of Matrix Multiplication
10:46
Associative Property
11:00
Associative Property (Scalar)
11:28
Distributive Property
12:06
Distributive Property (Scalar)
12:30
Example 1: Possible Matrices
13:31
Example 2: Multiplying Matrices
17:08
Example 3: Multiplying Matrices
20:41
Example 4: Matrix Properties
24:41
Determinants

33m 13s

Intro
0:00
What is a Determinant
0:13
Square Matrices
0:23
Vertical Bars
0:41
Determinant of a 2x2 Matrix
1:21
Second Order Determinant
1:37
Formula
1:45
Example: 2x2 Determinant
1:58
Determinant of a 3x3 Matrix
2:50
Expansion by Minors
3:08
Third Order Determinant
3:19
Expanding Row One
4:06
Example: 3x3 Determinant
6:40
Diagonal Method for 3x3 Matrices
13:24
Example: Diagonal Method
13:36
Example 1: Determinant of 2x2
18:59
Example 2: Determinant of 3x3
20:03
Example 3: Determinant of 3x3
25:35
Example 4: Determinant of 3x3
29:22
Cramer's Rule

28m 25s

Intro
0:00
System of Two Equations in Two Variables
0:16
One Variable
0:50
Determinant of Denominator
1:14
Determinants of Numerators
2:23
Example: System of Equations
3:34
System of Three Equations in Three Variables
7:06
Determinant of Denominator
7:17
Determinants of Numerators
7:52
Example 1: Two Equations
8:57
Example 2: Two Equations
13:21
Example 3: Three Equations
17:11
Example 4: Three Equations
23:43
Identity and Inverse Matrices

22m 25s

Intro
0:00
Identity Matrix
0:13
Example: 2x2 Identity Matrix
0:30
Example: 4x4 Identity Matrix
0:50
Properties of Identity Matrices
1:24
Example: Multiplying Identity Matrix
2:52
Matrix Inverses
5:30
Writing Matrix Inverse
6:07
Inverse of a 2x2 Matrix
6:39
Example: 2x2 Matrix
7:31
Example 1: Inverse Matrix
10:18
Example 2: Find the Inverse Matrix
13:04
Example 3: Find the Inverse Matrix
17:53
Example 4: Find the Inverse Matrix
20:44
Solving Systems of Equations Using Matrices

22m 32s

Intro
0:00
Matrix Equations
0:11
Example: System of Equations
0:21
Solving Systems of Equations
4:01
Isolate x
4:16
Example: Using Numbers
5:10
Multiplicative Inverse
5:54
Example 1: Write as Matrix Equation
7:18
Example 2: Use Matrix Equations
9:12
Example 3: Use Matrix Equations
15:06
Example 4: Use Matrix Equations
19:35
Section 5: Quadratic Functions and Inequalities
Graphing Quadratic Functions

31m 48s

Intro
0:00
Quadratic Functions
0:12
A is Zero
0:27
Example: Parabola
0:45
Properties of Parabolas
2:08
Axis of Symmetry
2:11
Vertex
2:32
Example: Parabola
2:48
Minimum and Maximum Values
9:02
Positive or Negative
9:28
Upward or Downward
9:58
Example: Minimum
10:31
Example: Maximum
11:16
Example 1: Axis of Symmetry, Vertex, Graph
12:41
Example 2: Axis of Symmetry, Vertex, Graph
17:25
Example 3: Minimum or Maximum
21:47
Example 4: Minimum or Maximum
27:09
Solving Quadratic Equations by Graphing

27m 3s

Intro
0:00
Quadratic Equations
0:16
Standard Form
0:18
Example: Quadratic Equation
0:47
Solving by Graphing
1:41
Roots (x-Intercepts)
1:48
Example: Number of Solutions
2:12
Estimating Solutions
9:23
Example: Integer Solutions
9:30
Example: Estimating
9:53
Example 1: Solve by Graphing
10:52
Example 2: Solve by Graphing
15:10
Example 1: Solve by Graphing
17:50
Example 1: Solve by Graphing
20:54
Solving Quadratic Equations by Factoring

19m 53s

Intro
0:00
Factoring Techniques
0:15
Greatest Common Factor (GCF)
0:37
Difference of Two Squares
1:48
Perfect Square Trinomials
2:30
General Trinomials
3:09
Zero Product Rule
5:22
Example: Zero Product
5:53
Example 1: Solve by Factoring
7:46
Example 1: Solve by Factoring
9:48
Example 1: Solve by Factoring
12:34
Example 1: Solve by Factoring
15:28
Imaginary and Complex Numbers

35m 45s

Intro
0:00
Properties of Square Roots
0:10
Product Property
0:26
Example: Product Property
0:56
Quotient Property
2:17
Example: Quotient Property
2:35
Imaginary Numbers
3:12
Imaginary i
3:51
Examples: Imaginary Number
4:22
Complex Numbers
7:23
Real Part and Imaginary Part
7:33
Examples: Complex Numbers
7:57
Equality
9:37
Example: Equal Complex Numbers
9:52
Addition and Subtraction
10:12
Examples: Adding Complex Numbers
10:25
Complex Plane
13:32
Horizontal Axis (Real)
13:49
Vertical Axis (Imaginary)
13:59
Example: Labeling
14:11
Multiplication
15:57
Example: FOIL Method
16:03
Division
18:37
Complex Conjugates
18:45
Conjugate Pairs
19:10
Example: Dividing Complex Numbers
20:00
Example 1: Simplify Complex Number
24:50
Example 2: Simplify Complex Number
27:56
Example 3: Multiply Complex Numbers
29:27
Example 3: Dividing Complex Numbers
31:48
Completing the Square

27m 11s

Intro
0:00
Square Root Property
0:12
Example: Perfect Square
0:38
Example: Perfect Square Trinomial
3:00
Completing the Square
4:39
Constant Term
4:50
Example: Complete the Square
5:04
Solve Equations
6:42
Add to Both Sides
6:59
Example: Complete the Square
7:07
Equations Where a Not Equal to 1
10:58
Divide by Coefficient
11:08
Example: Complete the Square
11:24
Complex Solutions
14:05
Real and Imaginary
14:14
Example: Complex Solution
14:35
Example 1: Square Root Property
18:31
Example 2: Complete the Square
19:15
Example 3: Complete the Square
20:40
Example 4: Complete the Square
23:56
Quadratic Formula and the Discriminant

22m 48s

Intro
0:00
Quadratic Formula
0:21
Standard Form
0:29
Example: Quadratic Formula
0:57
One Rational Root
3:00
Example: One Root
3:31
Complex Solutions
6:16
Complex Conjugate
6:28
Example: Complex Solution
7:15
Discriminant
9:42
Positive Discriminant
10:03
Perfect Square (Rational)
10:51
Not Perfect Square (2 Irrational)
11:27
Negative Discriminant
12:28
Zero Discriminant
12:57
Example 1: Quadratic Formula
13:50
Example 2: Quadratic Formula
16:03
Example 3: Quadratic Formula
19:00
Example 4: Discriminant
21:33
Analyzing the Graphs of Quadratic Functions

30m 7s

Intro
0:00
Vertex Form
0:12
H and K
0:32
Axis of Symmetry
0:36
Vertex
0:42
Example: Origin
1:00
Example: k = 2
2:12
Example: h = 1
4:27
Significance of Coefficient a
7:13
Example: |a| > 1
7:25
Example: |a| < 1
8:18
Example: |a| > 0
8:51
Example: |a| < 0
9:05
Writing Quadratic Equations in Vertex Form
10:22
Standard Form to Vertex Form
10:35
Example: Standard Form
11:02
Example: a Term Not 1
14:42
Example 1: Vertex Form
19:47
Example 2: Vertex Form
22:09
Example 3: Vertex Form
24:32
Example 4: Vertex Form
28:23
Graphing and Solving Quadratic Inequalities

27m 5s

Intro
0:00
Graphing Quadratic Inequalities
0:11
Test Point
0:18
Example: Quadratic Inequality
0:29
Solving Quadratic Inequalities
3:57
Example: Parameter
4:24
Example 1: Graph Inequality
11:16
Example 2: Solve Inequality
14:27
Example 3: Graph Inequality
19:14
Example 4: Solve Inequality
23:48
Section 6: Polynomial Functions
Properties of Exponents

19m 29s

Intro
0:00
Simplifying Exponential Expressions
0:09
Monomial Simplest Form
0:19
Negative Exponents
1:07
Examples: Simple
1:34
Properties of Exponents
3:06
Negative Exponents
3:13
Mutliplying Same Base
3:24
Dividing Same Base
3:45
Raising Power to a Power
4:33
Parentheses (Multiplying)
5:11
Parentheses (Dividing)
5:47
Raising to 0th Power
6:15
Example 1: Simplify Exponents
7:59
Example 2: Simplify Exponents
10:41
Example 3: Simplify Exponents
14:11
Example 4: Simplify Exponents
18:04
Operations on Polynomials

13m 27s

Intro
0:00
Adding and Subtracting Polynomials
0:13
Like Terms and Like Monomials
0:23
Examples: Adding Monomials
1:14
Multiplying Polynomials
3:40
Distributive Property
3:44
Example: Monomial by Polynomial
4:06
Example 1: Simplify Polynomials
5:47
Example 2: Simplify Polynomials
6:28
Example 3: Simplify Polynomials
8:38
Example 4: Simplify Polynomials
10:47
Dividing Polynomials

31m 11s

Intro
0:00
Dividing by a Monomial
0:13
Example: Numbers
0:26
Example: Polynomial by a Monomial
1:18
Long Division
2:28
Remainder Term
2:41
Example: Dividing with Numbers
3:04
Example: With Polynomials
5:01
Example: Missing Terms
7:58
Synthetic Division
11:44
Restriction
12:04
Example: Divisor in Form
12:20
Divisor in Synthetic Division
15:54
Example: Coefficient to 1
16:07
Example 1: Divide Polynomials
17:10
Example 2: Divide Polynomials
19:08
Example 3: Synthetic Division
21:42
Example 4: Synthetic Division
25:09
Polynomial Functions

22m 30s

Intro
0:00
Polynomial in One Variable
0:13
Leading Coefficient
0:27
Example: Polynomial
1:18
Degree
1:31
Polynomial Functions
2:57
Example: Function
3:13
Function Values
3:33
Example: Numerical Values
3:53
Example: Algebraic Expressions
5:11
Zeros of Polynomial Functions
5:50
Odd Degree
6:04
Even Degree
7:29
End Behavior
8:28
Even Degrees
9:09
Example: Leading Coefficient +/-
9:23
Odd Degrees
12:51
Example: Leading Coefficient +/-
13:00
Example 1: Degree and Leading Coefficient
15:03
Example 2: Polynomial Function
15:56
Example 3: Polynomial Function
17:34
Example 4: End Behavior
19:53
Analyzing Graphs of Polynomial Functions

33m 29s

Intro
0:00
Graphing Polynomial Functions
0:11
Example: Table and End Behavior
0:39
Location Principle
4:43
Zero Between Two Points
5:03
Example: Location Principle
5:21
Maximum and Minimum Points
8:40
Relative Maximum and Relative Minimum
9:16
Example: Number of Relative Max/Min
11:11
Example 1: Graph Polynomial Function
11:57
Example 2: Graph Polynomial Function
16:19
Example 3: Graph Polynomial Function
23:27
Example 4: Graph Polynomial Function
28:35
Solving Polynomial Functions

21m 10s

Intro
0:00
Factoring Polynomials
0:06
Greatest Common Factor (GCF)
0:25
Difference of Two Squares
1:14
Perfect Square Trinomials
2:07
General Trinomials
2:57
Grouping
4:32
Sum and Difference of Two Cubes
6:03
Examples: Two Cubes
6:14
Quadratic Form
8:22
Example: Quadratic Form
8:44
Example 1: Factor Polynomial
12:03
Example 2: Factor Polynomial
13:54
Example 3: Quadratic Form
15:33
Example 4: Solve Polynomial Function
17:24
Remainder and Factor Theorems

31m 21s

Intro
0:00
Remainder Theorem
0:07
Checking Work
0:22
Dividend and Divisor in Theorem
1:12
Example: f(a)
2:05
Synthetic Substitution
5:43
Example: Polynomial Function
6:15
Factor Theorem
9:54
Example: Numbers
10:16
Example: Confirm Factor
11:27
Factoring Polynomials
14:48
Example: 3rd Degree Polynomial
15:07
Example 1: Remainder Theorem
19:17
Example 2: Other Factors
21:57
Example 3: Remainder Theorem
25:52
Example 4: Other Factors
28:21
Roots and Zeros

31m 27s

Intro
0:00
Number of Roots
0:08
Not Nature of Roots
0:18
Example: Real and Complex Roots
0:25
Descartes' Rule of Signs
2:05
Positive Real Roots
2:21
Example: Positve
2:39
Negative Real Roots
5:44
Example: Negative
6:06
Finding the Roots
9:59
Example: Combination of Real and Complex
10:07
Conjugate Roots
13:18
Example: Conjugate Roots
13:50
Example 1: Solve Polynomial
16:03
Example 2: Solve Polynomial
18:36
Example 3: Possible Combinations
23:13
Example 4: Possible Combinations
27:11
Rational Zero Theorem

31m 16s

Intro
0:00
Equation
0:08
List of Possibilities
0:16
Equation with Constant and Leading Coefficient
1:04
Example: Rational Zero
2:46
Leading Coefficient Equal to One
7:19
Equation with Leading Coefficient of One
7:34
Example: Coefficient Equal to 1
8:45
Finding Rational Zeros
12:58
Division with Remainder Zero
13:32
Example 1: Possible Rational Zeros
14:20
Example 2: Possible Rational Zeros
16:02
Example 3: Possible Rational Zeros
19:58
Example 4: Find All Zeros
22:06
Section 7: Radical Expressions and Inequalities
Operations on Functions

34m 30s

Intro
0:00
Arithmetic Operations
0:07
Domain
0:16
Intersection
0:24
Denominator is Zero
0:49
Example: Operations
1:02
Composition of Functions
7:18
Notation
7:48
Right to Left
8:18
Example: Composition
8:48
Composition is Not Commutative
17:23
Example: Not Commutative
17:51
Example 1: Function Operations
20:55
Example 2: Function Operations
24:34
Example 3: Compositions
27:51
Example 4: Function Operations
31:09
Inverse Functions and Relations

22m 42s

Intro
0:00
Inverse of a Relation
0:14
Example: Ordered Pairs
0:56
Inverse of a Function
3:24
Domain and Range Switched
3:52
Example: Inverse
4:28
Procedure to Construct an Inverse Function
6:42
f(x) to y
6:42
Interchange x and y
6:59
Solve for y
7:06
Write Inverse f(x) for y
7:14
Example: Inverse Function
7:25
Example: Inverse Function 2
8:48
Inverses and Compositions
10:44
Example: Inverse Composition
11:46
Example 1: Inverse Relation
14:49
Example 2: Inverse of Function
15:40
Example 3: Inverse of Function
17:06
Example 4: Inverse Functions
18:55
Square Root Functions and Inequalities

30m 4s

Intro
0:00
Square Root Functions
0:07
Examples: Square Root Function
0:16
Example: Not Square Root Function
0:46
Radicand
1:12
Example: Restriction
1:31
Graphing Square Root Functions
3:42
Example: Graphing
3:49
Square Root Inequalities
8:47
Same Technique
9:00
Example: Square Root Inequality
9:20
Example 1: Graph Square Root Function
15:19
Example 2: Graph Square Root Function
18:03
Example 3: Graph Square Root Function
22:41
Example 4: Square Root Inequalities
25:37
nth Roots

20m 46s

Intro
0:00
Definition of the nth Root
0:07
Example: 5th Root
0:20
Example: 6th Root
0:51
Principal nth Root
1:39
Example: Principal Roots
2:06
Using Absolute Values
5:58
Example: Square Root
6:18
Example: 6th Root
8:40
Example: Negative
10:15
Example 1: Simplify Radicals
12:23
Example 2: Simplify Radicals
13:29
Example 3: Simplify Radicals
16:07
Example 4: Simplify Radicals
18:18
Operations with Radical Expressions

41m 11s

Intro
0:00
Properties of Radicals
0:16
Quotient Property
0:29
Example: Quotient
1:00
Example: Product Property
1:47
Simplifying Radical Expressions
3:24
Radicand No nth Powers
3:47
Radicand No Fractions
6:33
No Radicals in Denominator
7:16
Rationalizing Denominators
8:27
Example: Radicand nth Power
9:05
Conjugate Radical Expressions
11:47
Conjugates
12:07
Example: Conjugate Radical Expression
13:11
Adding and Subtracting Radicals
16:12
Same Index, Same Radicand
16:20
Example: Like Radicals
16:28
Multiplying Radicals
19:04
Distributive Property
19:10
Example: Multiplying Radicals
19:20
Example 1: Simplify Radical
24:11
Example 2: Simplify Radicals
28:43
Example 3: Simplify Radicals
32:00
Example 4: Simplify Radical
36:34
Rational Exponents

30m 45s

Intro
0:00
Definition 1
0:20
Example: Using Numbers
0:39
Example: Non-Negative
2:46
Example: Odd
3:34
Definition 2
4:32
Restriction
4:52
Example: Relate to Definition 1
5:04
Example: m Not 1
5:31
Simplifying Expressions
7:53
Multiplication
8:31
Division
9:29
Multiply Exponents
10:08
Raised Power
11:05
Zero Power
11:29
Negative Power
11:49
Simplified Form
13:52
Complex Fraction
14:16
Negative Exponents
14:40
Example: More Complicated
15:14
Example 1: Write as Radical
19:03
Example 2: Write with Rational Exponents
20:40
Example 3: Complex Fraction
22:09
Example 4: Complex Fraction
26:22
Solving Radical Equations and Inequalities

31m 27s

Intro
0:00
Radical Equations
0:11
Variables in Radicands
0:22
Example: Radical Equation
1:06
Example: Complex Equation
2:42
Extraneous Roots
7:21
Squaring Technique
7:35
Double Check
7:44
Example: Extraneous
8:21
Eliminating nth Roots
10:04
Isolate and Raise Power
10:14
Example: nth Root
10:27
Radical Inequalities
11:27
Restriction: Index is Even
11:53
Example: Radical Inequality
12:29
Example 1: Solve Radical Equation
15:41
Example 2: Solve Radical Equation
17:44
Example 3: Solve Radical Inequality
20:24
Example 4: Solve Radical Equation
24:34
Section 8: Rational Equations and Inequalities
Multiplying and Dividing Rational Expressions

40m 54s

Intro
0:00
Simplifying Rational Expressions
0:22
Algebraic Fraction
0:29
Examples: Rational Expressions
0:49
Example: GCF
1:33
Example: Simplify Rational Expression
2:26
Factoring -1
4:04
Example: Simplify with -1
4:19
Multiplying and Dividing Rational Expressions
6:59
Multiplying and Dividing
7:28
Example: Multiplying Rational Expressions
8:36
Example: Dividing Rational Expressions
11:20
Factoring
14:01
Factoring Polynomials
14:19
Example: Factoring
14:35
Complex Fractions
18:22
Example: Numbers
18:37
Example: Algebraic Complex Fractions
19:25
Example 1: Simplify Rational Expression
25:56
Example 2: Simplify Rational Expression
29:34
Example 3: Simplify Rational Expression
31:39
Example 4: Simplify Rational Expression
37:50
Adding and Subtracting Rational Expressions

55m 4s

Intro
0:00
Least Common Multiple (LCM)
0:27
Examples: LCM of Numbers
0:43
Example: LCM of Polynomials
4:02
Adding and Subtracting
7:55
Least Common Denominator (LCD)
8:07
Example: Numbers
8:17
Example: Rational Expressions
11:03
Equivalent Fractions
15:22
Simplifying Complex Fractions
21:19
Example: Previous Lessons
21:36
Example: More Complex
22:53
Example 1: Find LCM
28:30
Example 2: Add Rational Expressions
31:44
Example 3: Subtract Rational Expressions
39:18
Example 4: Simplify Rational Expression
38:26
Graphing Rational Functions

57m 13s

Intro
0:00
Rational Functions
0:18
Restriction
0:34
Example: Rational Function
0:51
Breaks in Continuity
2:52
Example: Continuous Function
3:10
Discontinuities
3:30
Example: Excluded Values
4:37
Graphs and Discontinuities
5:02
Common Binomial Factor (Hole)
5:08
Example: Common Factor
5:31
Asymptote
10:06
Example: Vertical Asymptote
11:08
Horizontal Asymptotes
20:00
Example: Horizontal Asymptote
20:25
Example 1: Holes and Vertical Asymptotes
26:12
Example 2: Graph Rational Faction
28:35
Example 3: Graph Rational Faction
39:23
Example 4: Graph Rational Faction
47:28
Direct, Joint, and Inverse Variation

20m 21s

Intro
0:00
Direct Variation
0:07
Constant of Variation
0:25
Graph of Constant Variation
1:26
Slope is Constant k
1:35
Example: Straight Lines
1:41
Joint Variation
2:48
Three Variables
2:52
Inverse Variation
3:38
Rewritten Form
3:52
Examples in Biology
4:22
Graph of Inverse Variation
4:51
Asymptotes are Axes
5:12
Example: Inverse Variation
5:40
Proportions
10:11
Direct Variation
10:25
Inverse Variation
11:32
Example 1: Type of Variation
12:42
Example 2: Direct Variation
14:13
Example 3: Joint Variation
16:24
Example 4: Graph Rational Faction
18:50
Solving Rational Equations and Inequalities

55m 14s

Intro
0:00
Rational Equations
0:15
Example: Algebraic Fraction
0:26
Least Common Denominator
0:49
Example: Simple Rational Equation
1:22
Example: Solve Rational Equation
5:40
Extraneous Solutions
9:31
Doublecheck
10:00
No Solution
10:38
Example: Extraneous
10:44
Rational Inequalities
14:01
Excluded Values
14:31
Solve Related Equation
14:49
Find Intervals
14:58
Use Test Values
15:25
Example: Rational Inequality
15:51
Example: Rational Inequality 2
17:07
Example 1: Rational Equation
28:50
Example 2: Rational Equation
33:51
Example 3: Rational Equation
38:19
Example 4: Rational Inequality
46:49
Section 9: Exponential and Logarithmic Relations
Exponential Functions

35m 58s

Intro
0:00
What is an Exponential Function?
0:12
Restriction on b
0:31
Base
0:46
Example: Exponents as Bases
0:56
Variables as Exponents
1:12
Example: Exponential Function
1:50
Graphing Exponential Functions
2:33
Example: Using Table
2:49
Properties
11:52
Continuous and One to One
12:00
Domain is All Real Numbers
13:14
X-Axis Asymptote
13:55
Y-Intercept
14:02
Reflection Across Y-Axis
14:31
Growth and Decay
15:06
Exponential Growth
15:10
Real Life Examples
15:41
Example: Growth
15:52
Example: Decay
16:12
Real Life Examples
16:30
Equations
17:32
Bases are Same
18:05
Examples: Variables as Exponents
18:20
Inequalities
21:29
Property
21:51
Example: Inequality
22:37
Example 1: Graph Exponential Function
24:05
Example 2: Growth or Decay
27:50
Example 3: Exponential Equation
29:31
Example 4: Exponential Inequality
32:54
Logarithms and Logarithmic Functions

45m 54s

Intro
0:00
What are Logarithms?
0:08
Restrictions
0:15
Written Form
0:26
Logarithms are Exponents
0:52
Example: Logarithms
1:49
Logarithmic Functions
5:14
Same Restrictions
5:30
Inverses
5:53
Example: Logarithmic Function
6:24
Graph of the Logarithmic Function
9:20
Example: Using Table
9:35
Properties
15:09
Continuous and One to One
15:14
Domain
15:36
Range
15:56
Y-Axis is Asymptote
16:02
X Intercept
16:12
Inverse Property
16:57
Compositions of Functions
17:10
Equations
18:30
Example: Logarithmic Equation
19:13
Inequalities
20:36
Properties
20:47
Example: Logarithmic Inequality
21:40
Equations with Logarithms on Both Sides
24:43
Property
24:51
Example: Both Sides
25:23
Inequalities with Logarithms on Both Sides
26:52
Property
27:02
Example: Both Sides
28:05
Example 1: Solve Log Equation
31:52
Example 2: Solve Log Equation
33:53
Example 3: Solve Log Equation
36:15
Example 4: Solve Log Inequality
39:19
Properties of Logarithms

28m 43s

Intro
0:00
Product Property
0:08
Example: Product
0:46
Quotient Property
2:40
Example: Quotient
2:59
Power Property
3:51
Moved Exponent
4:07
Example: Power
4:37
Equations
5:15
Example: Use Properties
5:58
Example 1: Simplify Log
11:17
Example 2: Single Log
15:54
Example 3: Solve Log Equation
18:48
Example 4: Solve Log Equation
22:13
Common Logarithms

25m 23s

Intro
0:00
What are Common Logarithms?
0:10
Real World Applications
0:16
Base Not Written
0:27
Example: Base 10
0:39
Equations
1:47
Example: Same Base
1:56
Example: Different Base
2:37
Inequalities
6:07
Multiplying/Dividing Inequality
6:21
Example: Log Inequality
6:54
Change of Base
12:45
Base 10
13:24
Example: Change of Base
14:05
Example 1: Log Equation
15:21
Example 2: Common Logs
17:13
Example 3: Log Equation
18:22
Example 4: Log Inequality
21:52
Base e and Natural Logarithms

21m 14s

Intro
0:00
Number e
0:09
Natural Base
0:21
Growth/Decay
0:33
Example: Exponential Function
0:53
Natural Logarithms
1:11
ln x
1:19
Inverse and Identity Function
1:39
Example: Inverse Composition
1:55
Equations and Inequalities
4:39
Extraneous Solutions
5:30
Examples: Natural Log Equations
5:48
Example 1: Natural Log Equation
9:08
Example 2: Natural Log Equation
10:37
Example 3: Natural Log Inequality
16:54
Example 4: Natural Log Inequality
18:16
Exponential Growth and Decay

24m 30s

Intro
0:00
Decay
0:17
Decreases by Fixed Percentage
0:23
Rate of Decay
0:56
Example: Finance
1:34
Scientific Model of Decay
3:37
Exponential Decay
3:45
Radioactive Decay
4:13
Example: Half Life
5:33
Growth
9:06
Increases by Fixed Percentage
9:18
Example: Finance
10:09
Scientific Model of Growth
11:35
Population Growth
12:04
Example: Growth
12:20
Example 1: Computer Price
14:00
Example 2: Stock Price
15:46
Example 3: Medicine Disintegration
19:10
Example 4: Population Growth
22:33
Section 10: Conic Sections
Midpoint and Distance Formulas

32m 42s

Intro
0:00
Midpoint Formula
0:15
Example: Midpoint
0:30
Distance Formula
2:30
Example: Distance
2:52
Example 1: Midpoint and Distance
4:58
Example 2: Midpoint and Distance
8:07
Example 3: Median Length
18:51
Example 4: Perimeter and Area
23:36
Parabolas

41m 27s

Intro
0:00
What is a Parabola?
0:20
Definition of a Parabola
0:29
Focus
0:59
Directrix
1:15
Axis of Symmetry
3:08
Vertex
3:33
Minimum or Maximum
3:44
Standard Form
4:59
Horizontal Parabolas
5:08
Vertex Form
5:19
Upward or Downward
5:41
Example: Standard Form
6:06
Graphing Parabolas
8:31
Shifting
8:51
Example: Completing the Square
9:22
Symmetry and Translation
12:18
Example: Graph Parabola
12:40
Latus Rectum
17:13
Length
18:15
Example: Latus Rectum
18:35
Horizontal Parabolas
18:57
Not Functions
20:08
Example: Horizontal Parabola
21:21
Focus and Directrix
24:11
Horizontal
24:48
Example 1: Parabola Standard Form
25:12
Example 2: Graph Parabola
30:00
Example 3: Graph Parabola
33:13
Example 4: Parabola Equation
37:28
Circles

21m 3s

Intro
0:00
What are Circles?
0:08
Example: Equidistant
0:17
Radius
0:32
Equation of a Circle
0:44
Example: Standard Form
1:11
Graphing Circles
1:47
Example: Circle
1:56
Center Not at Origin
3:07
Example: Completing the Square
3:51
Example 1: Equation of Circle
6:44
Example 2: Center and Radius
11:51
Example 3: Radius
15:08
Example 4: Equation of Circle
16:57
Ellipses

46m 51s

Intro
0:00
What Are Ellipses?
0:11
Foci
0:23
Properties of Ellipses
1:43
Major Axis, Minor Axis
1:47
Center
1:54
Length of Major Axis and Minor Axis
3:21
Standard Form
5:33
Example: Standard Form of Ellipse
6:09
Vertical Major Axis
9:14
Example: Vertical Major Axis
9:46
Graphing Ellipses
12:51
Complete the Square and Symmetry
13:00
Example: Graphing Ellipse
13:16
Equation with Center at (h, k)
19:57
Horizontal and Vertical
20:14
Difference
20:27
Example: Center at (h, k)
20:55
Example 1: Equation of Ellipse
24:05
Example 2: Equation of Ellipse
27:57
Example 3: Equation of Ellipse
32:32
Example 4: Graph Ellipse
38:27
Hyperbolas

38m 15s

Intro
0:00
What are Hyperbolas?
0:12
Two Branches
0:18
Foci
0:38
Properties
2:00
Transverse Axis and Conjugate Axis
2:06
Vertices
2:46
Length of Transverse Axis
3:14
Distance Between Foci
3:31
Length of Conjugate Axis
3:38
Standard Form
5:45
Vertex Location
6:36
Known Points
6:52
Vertical Transverse Axis
7:26
Vertex Location
7:50
Asymptotes
8:36
Vertex Location
8:56
Rectangle
9:28
Diagonals
10:29
Graphing Hyperbolas
12:58
Example: Hyperbola
13:16
Equation with Center at (h, k)
16:32
Example: Center at (h, k)
17:21
Example 1: Equation of Hyperbola
19:20
Example 2: Equation of Hyperbola
22:48
Example 3: Graph Hyperbola
26:05
Example 4: Equation of Hyperbola
36:29
Conic Sections

18m 43s

Intro
0:00
Conic Sections
0:16
Double Cone Sections
0:24
Standard Form
1:27
General Form
1:37
Identify Conic Sections
2:16
B = 0
2:50
X and Y
3:22
Identify Conic Sections, Cont.
4:46
Parabola
5:17
Circle
5:51
Ellipse
6:31
Hyperbola
7:10
Example 1: Identify Conic Section
8:01
Example 2: Identify Conic Section
11:03
Example 3: Identify Conic Section
11:38
Example 4: Identify Conic Section
14:50
Solving Quadratic Systems

47m 4s

Intro
0:00
Linear Quadratic Systems
0:22
Example: Linear Quadratic System
0:45
Solutions
2:49
Graphs of Possible Solutions
3:10
Quadratic Quadratic System
4:10
Example: Elimination
4:21
Solutions
11:39
Example: 0, 1, 2, 3, 4 Solutions
11:50
Systems of Quadratic Inequalities
12:48
Example: Quadratic Inequality
13:09
Example 1: Solve Quadratic System
21:42
Example 2: Solve Quadratic System
29:13
Example 3: Solve Quadratic System
35:02
Example 4: Solve Quadratic Inequality
40:29
Section 11: Sequences and Series
Arithmetic Sequences

21m 16s

Intro
0:00
Sequences
0:10
General Form of Sequence
0:16
Example: Finite/Infinite Sequences
0:33
Arithmetic Sequences
0:28
Common Difference
2:41
Example: Arithmetic Sequence
2:50
Formula for the nth Term
3:51
Example: nth Term
4:32
Equation for the nth Term
6:37
Example: Using Formula
6:56
Arithmetic Means
9:47
Example: Arithmetic Means
10:16
Example 1: nth Term
12:38
Example 2: Arithmetic Means
13:49
Example 3: Arithmetic Means
16:12
Example 4: nth Term
18:26
Arithmetic Series

21m 36s

Intro
0:00
What are Arithmetic Series?
0:11
Common Difference
0:28
Example: Arithmetic Sequence
0:43
Example: Arithmetic Series
1:09
Finite/Infinite Series
1:36
Sum of Arithmetic Series
2:27
Example: Sum
3:21
Sigma Notation
5:53
Index
6:14
Example: Sigma Notation
7:14
Example 1: First Term
9:00
Example 2: Three Terms
10:52
Example 3: Sum of Series
14:14
Example 4: Sum of Series
18:13
Geometric Sequences

23m 3s

Intro
0:00
Geometric Sequences
0:11
Common Difference
0:38
Common Ratio
1:08
Example: Geometric Sequence
2:38
nth Term of a Geometric Sequence
4:41
Example: nth Term
4:56
Geometric Means
6:51
Example: Geometric Mean
7:09
Example 1: 9th Term
12:04
Example 2: Geometric Means
15:18
Example 3: nth Term
18:32
Example 4: Three Terms
20:59
Geometric Series

22m 43s

Intro
0:00
What are Geometric Series?
0:11
List of Numbers
0:24
Example: Geometric Series
1:12
Sum of Geometric Series
2:16
Example: Sum of Geometric Series
2:41
Sigma Notation
4:21
Lower Index, Upper Index
4:38
Example: Sigma Notation
4:57
Another Sum Formula
6:08
Example: n Unknown
6:28
Specific Terms
7:41
Sum Formula
7:56
Example: Specific Term
8:11
Example 1: Sum of Geometric Series
10:02
Example 2: Sum of 8 Terms
14:15
Example 3: Sum of Geometric Series
18:23
Example 4: First Term
20:16
Infinite Geometric Series

18m 32s

Intro
0:00
What are Infinite Geometric Series
0:10
Example: Finite
0:29
Example: Infinite
0:51
Partial Sums
1:09
Formula
1:37
Sum of an Infinite Geometric Series
2:39
Convergent Series
2:58
Example: Sum of Convergent Series
3:28
Sigma Notation
7:31
Example: Sigma
8:17
Repeating Decimals
8:42
Example: Repeating Decimal
8:53
Example 1: Sum of Infinite Geometric Series
12:15
Example 2: Repeating Decimal
13:24
Example 3: Sum of Infinite Geometric Series
15:14
Example 4: Repeating Decimal
16:48
Recursion and Special Sequences

14m 34s

Intro
0:00
Fibonacci Sequence
0:05
Background of Fibonacci
0:23
Recursive Formula
0:37
Fibonacci Sequence
0:52
Example: Recursive Formula
2:18
Iteration
3:49
Example: Iteration
4:30
Example 1: Five Terms
7:08
Example 2: Three Terms
9:00
Example 3: Five Terms
10:38
Example 4: Three Iterates
12:41
Binomial Theorem

48m 30s

Intro
0:00
Pascal's Triangle
0:06
Expand Binomial
0:13
Pascal's Triangle
4:26
Properties
6:52
Example: Properties of Binomials
6:58
Factorials
9:11
Product
9:28
Example: Factorial
9:45
Binomial Theorem
11:08
Example: Binomial Theorem
13:48
Finding a Specific Term
18:36
Example: Specific Term
19:26
Example 1: Expand
24:39
Example 2: Fourth Term
30:26
Example 3: Five Terms
36:13
Example 4: Three Iterates
45:07
Loading...
This is a quick preview of the lesson. For full access, please Log In or Sign up.
For more information, please see full course syllabus of Algebra 2
Bookmark & Share Embed

Share this knowledge with your friends!

Copy & Paste this embed code into your website’s HTML

Please ensure that your website editor is in text mode when you paste the code.
(In Wordpress, the mode button is on the top right corner.)
  ×
  • - Allow users to view the embedded video in full-size.
Since this lesson is not free, only the preview will appear on your website.
  • Discussion

  • Answer Engine

  • Study Guides

  • Practice Questions

  • Download Lecture Slides

  • Table of Contents

  • Transcription

  • Related Books

Lecture Comments (8)

0 answers

Post by Hong Yang on June 20, 2020

u guyd coolbrosman yette
kjdlhfjwdiuhkjfhJDSGSJKHagfedgfkAGVOSJHDajksFDBAKJHJDHFSAFKSADLjjhI am cool lame boi

1 answer

Last reply by: Khanh Nguyen
Sun Jan 3, 2016 6:37 PM

Post by Khanh Nguyen on January 3, 2016

At 32:48, for x = 5, 5 - 6 = -1. So the chart should have added a - sign to the 1.

You forgot to add the - sign.

2 answers

Last reply by: Kavita Agrawal
Wed Jun 19, 2013 10:07 PM

Post by Christine Kuhlman on September 17, 2012

Is there a time that a line could cross a horizontal asymptote? If so, how can you find out when and by how much it does.
I thought that with asymptotes the line could never touch it, but today my teacher told us they can cross and I'm very confused.

1 answer

Last reply by: Dr Carleen Eaton
Sat Feb 26, 2011 6:02 PM

Post by Edgar Rariton on February 26, 2011

Regarding example IV, you say that you're going to cancel out the common factors of x+3, but then you say to graph 2x-1/x+3.

You then continue to calculate points based on 2x-1/x-5.

You seemed to have made a typo.

Graphing Rational Functions

  • If the numerator and denominator have a common binomial factor, the graph will have a hole at the point where this factor is 0. If the denominator has a binomial factor that is not in the numerator, the graph will have a vertical asymptote at the point where this factor is 0.
  • The graph of a rational function often has a horizontal asymptote.

Graphing Rational Functions

Describe any holes and vertical asymptotes.
f(x) = [(2x − 6)/(x2 − 2x − 3)]
  • Holes occur when you have a common binomial factor that cancels out.
  • Vertical Asymptotes occur at restricted values in the domain. These are values of x that make the denominator equal to zero.
  • Step 1 - Factor
  • f(x) = [(2x − 6)/(x2 − 2x − 3)] = [(2( − ))/(( − )( + ))]
  • f(x) = [(2x − 6)/(x2 − 2x − 3)] = [(2(x − 3))/((x − 3)(x + 1))]
  • Step 2 - Identify holes by identifying common binomial factors. Then eliminate the binomial factors.
  • The only binomial factor is (x − 3), therefore, there will be a hole at x = 3
  • f(x) = [(2(x − 3))/((x − 3)(x + 1))] = [2/((x + 1))]
  • f(x) = [2/(x + 1)]
  • Step 3 - Identify vertical asymptotes by setting denominator equal to zero
  • x + 1 = 0
  • x = − 1
  • Holes:
  • Vertical Asymptote:
Holes: x = 3 Vertical Asymptote: x = − 1
Describe any holes and vertical asymptotes.
f(x) = [( − 3x2 − 3x)/(x2 − 1)]
  • Holes occur when you have a common binomial factor that cancels out.
  • Vertical Asymptotes occur at restricted values in the domain. These are values of x that make the denominator equal to zero.
  • Step 1 - Factor
  • f(x) = [( − 3x2 − 3x)/(x2 − 1)] = [( − 3x( − ))/(( + )( − ))]
  • f(x) = [( − 3x2 − 3x)/(x2 − 1)] = [( − 3x(x + 1))/((x + 1)(x − 1))]
  • Step 2 - Identify holes by identifying common binomial factors. Then eliminate the binomial factors.
  • The only binomial factor is (x + 1), therefore, there will be a hole at x = − 1
  • f(x) = [( − 3x)/((x − 1))]
  • f(x) = [( − 3x)/(x − 1)]
  • Step 3 - Identify vertical asymptotes by setting denominator equal to zero
  • x − 1 = 0
  • x = 1
  • Holes:
  • Vertical Asymptote:
Holes: x = − 1 Vertical Asymptote: x = 1
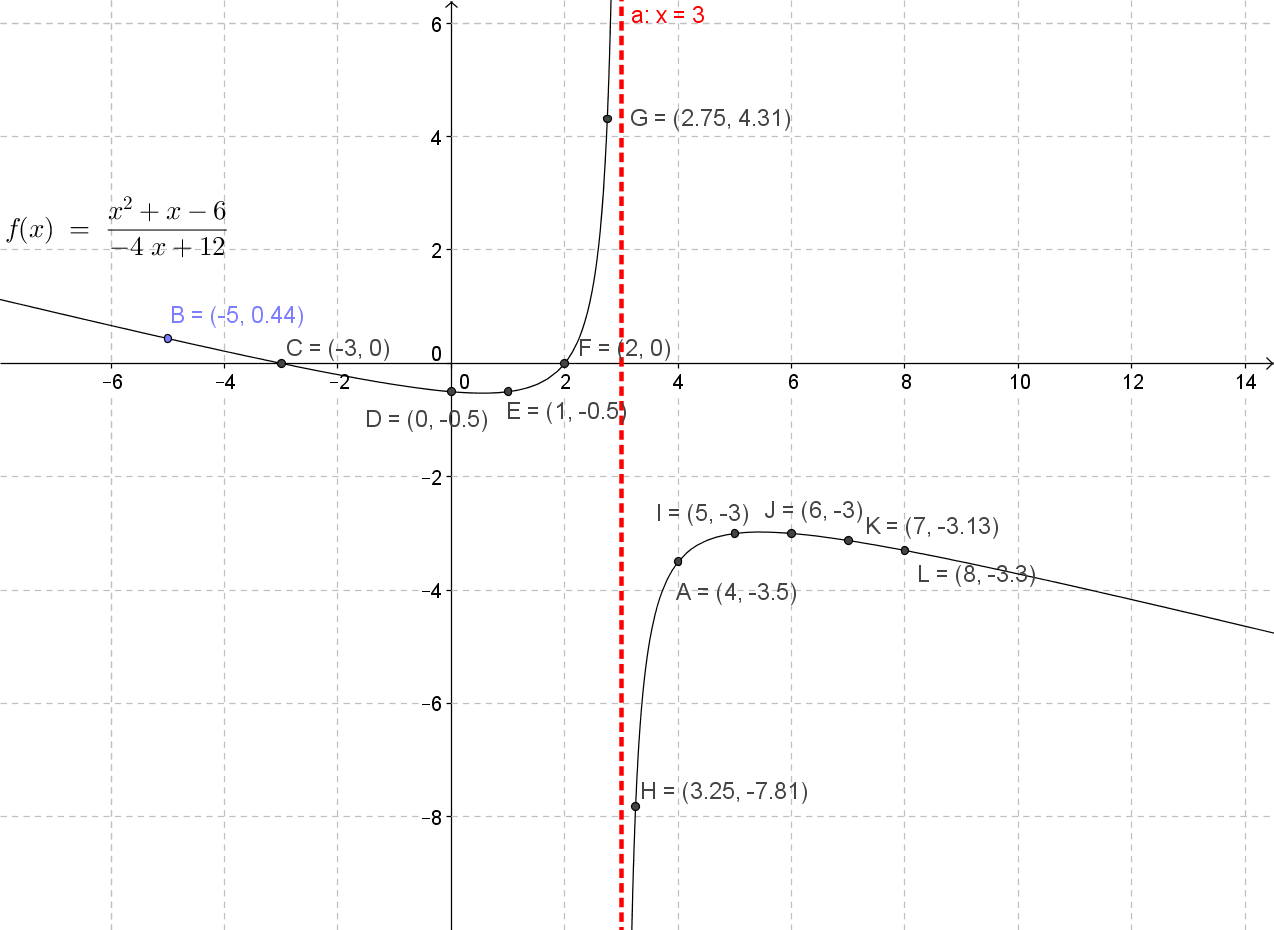
Graph
f(x) = [(x2 + x − 6)/( − 4x + 12)]
  • Holes occur when you have a common binomial factor that cancels out.
  • Vertical Asymptotes occur at restricted values in the domain. These are values of x that make the denominator equal to zero.
  • Step 1 - Factor
  • f(x) = [(x2 + x − 6)/( − 4x + 12)] = [(( + )( − ))/( − 4( − ))]
  • f(x) = [(x2 + x − 6)/( − 4x + 12)] = [((x + 3)(x − 2))/( − 4(x − 3))]
  • Step 2 - Identify holes by identifying common binomial factors. Then eliminate the binomial factors.
  • There are no holes in this graph.
  • Step 3 - Identify vertical asymptotes by setting denominator equal to zero
  • x − 3 = 0
  • x = 3
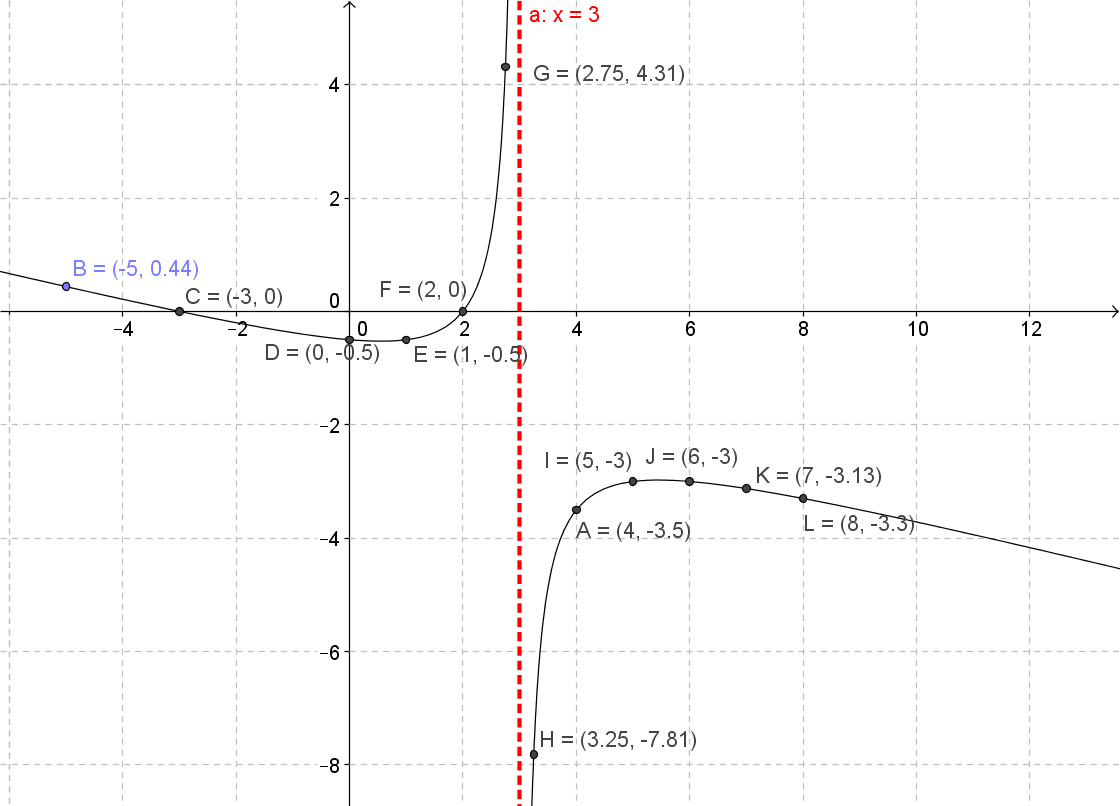
  • Step 4 - Graph the vertical asymptotes and create a table of values, with values of x to theleft and right of the vertical asymptote
  • xy=[(x2+x−6)/(−4x+12)]
    -50.44
    -30
    0-0.5
    1-0.5
    20
    2.754.31
    3.25-7.81
    4-3.5
    5-3
    6-3
    7-3.13
    8-3.3
  • Step 5 - Sketch the graph. Play close attention as you move closer to the vertical asymptote.
  • The graph should never cross the vertical asymptote.
Graph
f(x) = [(x2 − 7x + 12)/(x2 − 4)]
  • Holes occur when you have a common binomial factor that cancels out.
  • Vertical Asymptotes occur at restricted values in the domain. These are values of x that make
  • the denominator equal to zero.
  • Step 1 - Factor
  • f(x) = [(x2 − 7x + 12)/(x2 − 4)] = [(( − )( − ))/(( + )( − ))]
  • f(x) = [(x2 − 7x + 12)/(x2 − 4)] = [((x − 3 )(x − 4))/((x + 2)(x − 2))]
  • Step 2 - Identify holes by identifying common binomial factors. Then eliminate the binomial factors.
  • There are no holes in this graph.
  • Step 3 - Identify vertical asymptotes by setting denominator equal to zero
  • x + 2 = 0 and x − 2 = 0
  • x = − 2 and x = 2
  • Step 4 - Graph the vertical asymptotes and create a table of values, with values of x to theleft and right of the vertical asymptotes
  • xy=[((x−3)(x−4))/((x+2)(x−2))]
    -62.81
    -44.67
    -38.4
    -1.5-14.14
    0-3
    1-2
    1.5-2.14
    1.95-10.9
    2.059.15
    30
    40
    60.19
  • Step 5 - Sketch the graph. Play close attention as you move closer to the vertical asymptote.
  • The graph should never cross the vertical asymptote.
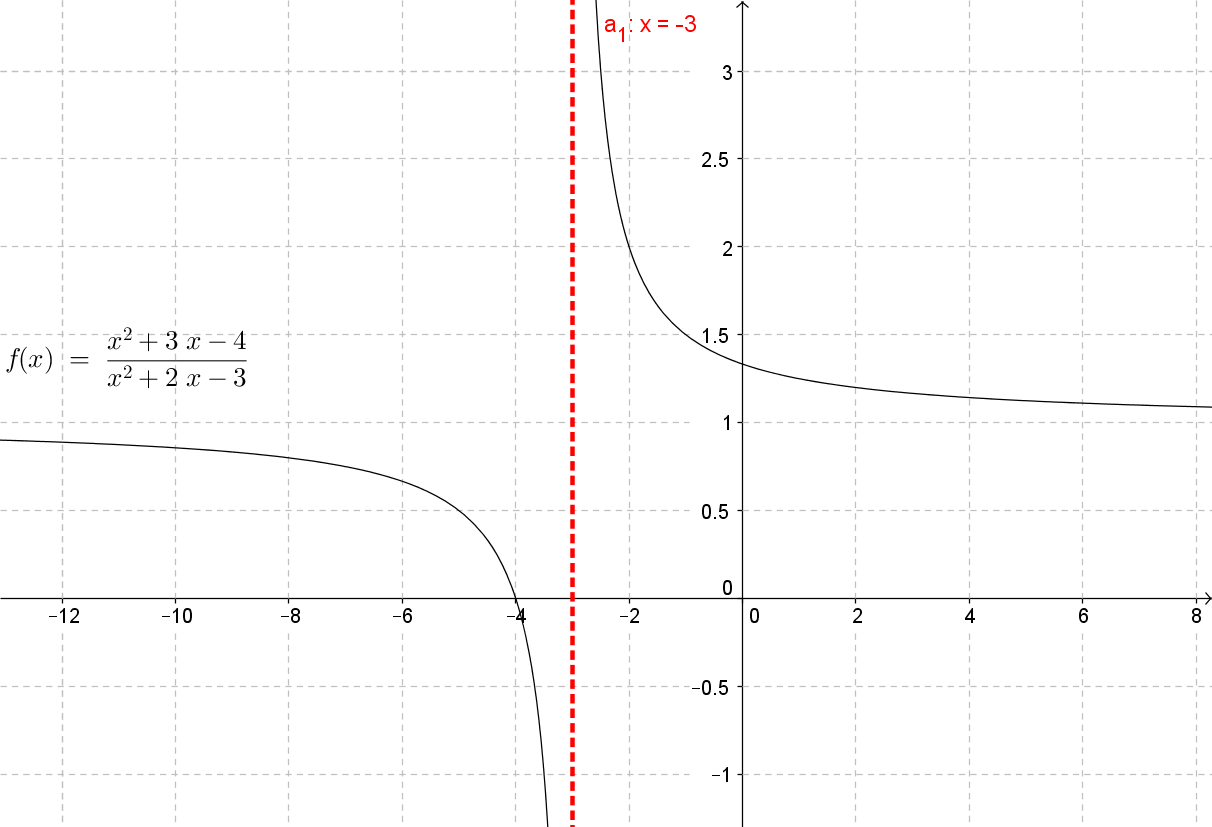
Graph
f(x) = [(x2 + 3x − 4)/(x2 + 2x − 3)]
  • Holes occur when you have a common binomial factor that cancels out.
  • Vertical Asymptotes occur at restricted values in the domain. These are values of x that make the denominator equal to zero.
  • Step 1 - Factor
  • f(x) = [(x2 + 3x − 4)/(x2 + 2x − 3)] = [(( + )( − ))/(( + )( − ))]
  • f(x) = [(x2 + 3x − 4)/(x2 + 2x − 3)] = [((x + 4)(x − 1))/((x + 3)(x − 1))]
  • Step 2 - Identify holes by identifying common binomial factors. Then eliminate the binomial factors.
  • Notice how there's only one hole, x = 1
  • f(x) = [((x + 4)(x − 1))/((x + 3)(x − 1))] = [((x + 4))/((x + 3))]
  • Step 3 - Identify vertical asymptotes by setting denominator equal to zero
  • x + 3 = 0 x = -3
  • Step 4 - Sketch the graph. Play close attention as you move closer to the vertical asymptote.
  • The graph should never cross the vertical asymptote.
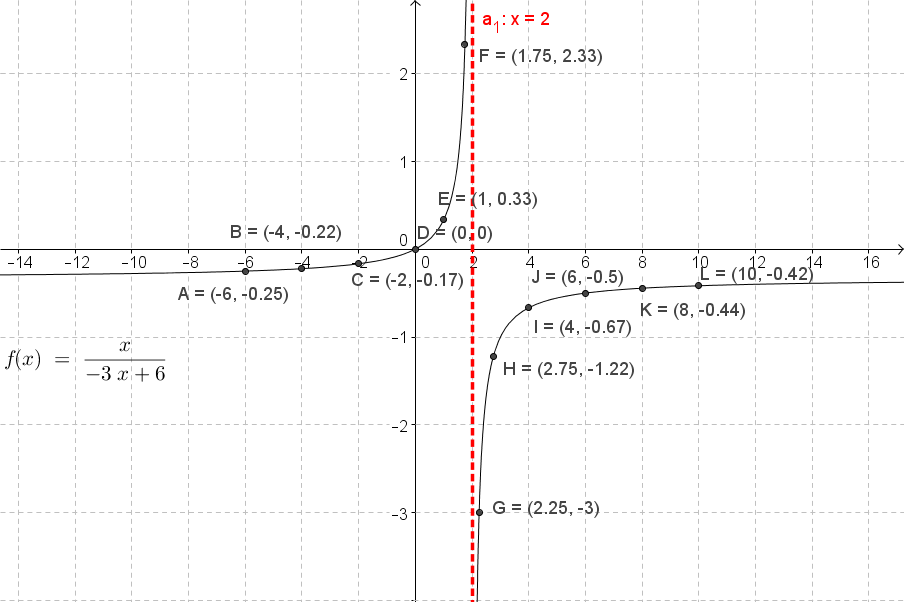
Graph
f(x) = [x/( − 3x + 6)]
  • Holes occur when you have a common binomial factor that cancels out.
  • Vertical Asymptotes occur at restricted values in the domain. These are values of x that make the denominator equal to zero.
  • Step 1 - Factor
  • f(x) = [x/( − 3x + 6)] = [x/( − 3( − ))]
  • f(x) = [x/( − 3x + 6)] = [x/( − 3(x − 2))]
  • Step 2 - Identify holes by identifying common binomial factors. Then eliminate the binomial factors.
  • Notice how there are no holes.
  • Step 3 - Identify vertical asymptotes by setting denominator equal to zero
  • x − 2 = 0
  • x = 2
  • Step 4 - Graph the vertical asymptotes and create a table of values, with values of x to theleft and right of the vertical asymptotes
  • x[x/(−3x+6)]
    -6-0.25
    -4-0.22
    -2-0.17
    00
    10.33
    1.752.33
    2.25-3
    2.75-1.22
    4-0.67
    6-0.5
    8-0.44
    10-0.42
  • Step 5 - Sketch the graph. Play close attention as you move closer to the vertical asymptote.
  • The graph should never cross the vertical asymptote.
Graph
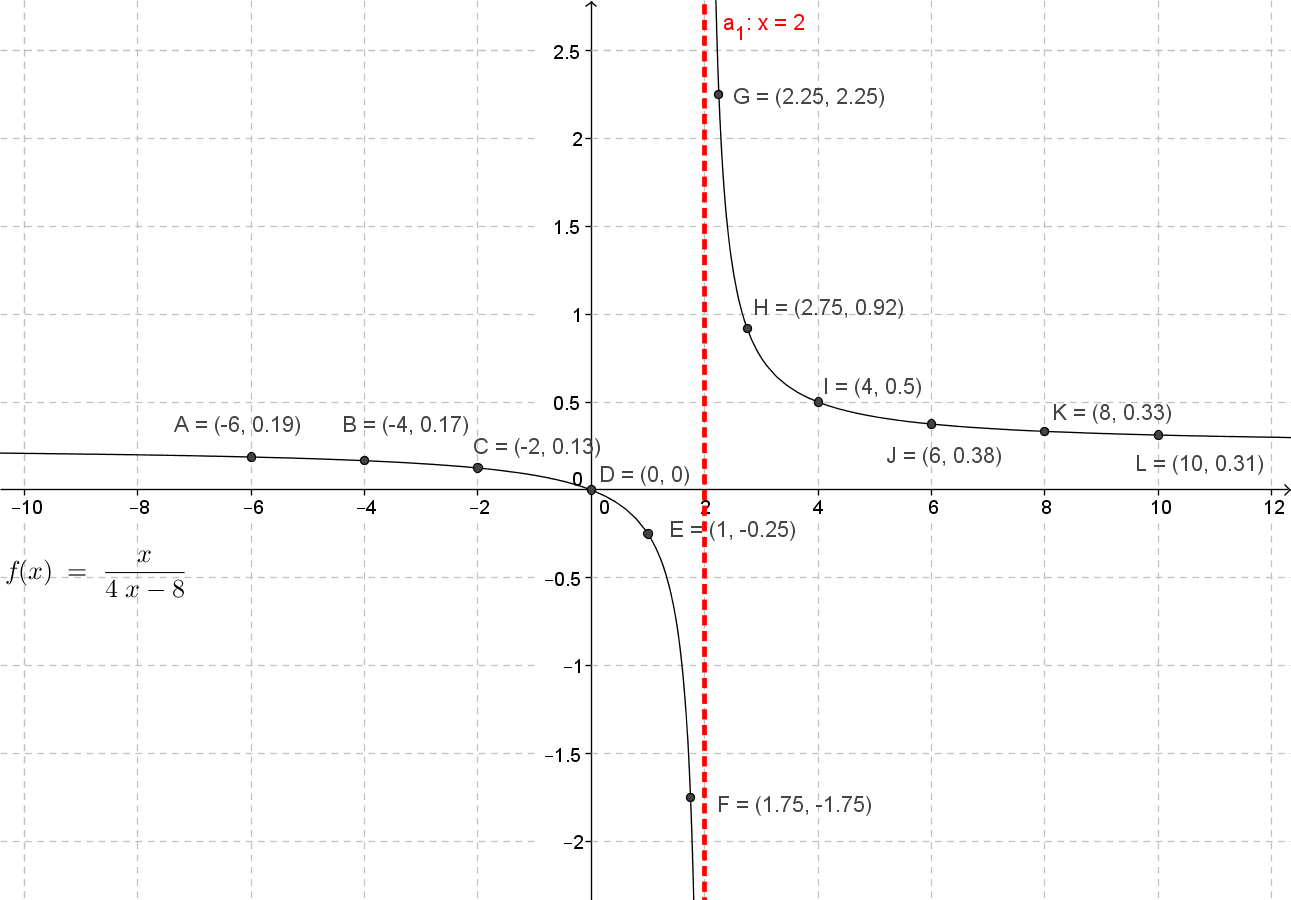
f(x) = [x/(4x − 8)]
  • Holes occur when you have a common binomial factor that cancels out.
  • Vertical Asymptotes occur at restricted values in the domain. These are values of x that make the denominator equal to zero.
  • Step 1 - Factor
  • f(x) = [x/(4x − 8)] = [x/(4( − ))]
  • f(x) = [x/(4x − 8)] = [x/(4(x − 2))]
  • Step 2 - Identify holes by identifying common binomial factors. Then eliminate the binomial factors.
  • Notice how there are no holes.
  • Step 3 - Identify vertical asymptotes by setting denominator equal to zero
  • x − 2 = 0
  • x = 2
  • Step 4 - Graph the vertical asymptotes and create a table of values, with values of x to the left and right of the vertical asymptotes
  • x[x/(4x+8)]
    -60.19
    -40.17
    -20.13
    00
    1-0.25
    1.75-1.75
    2.252.25
    2.750.92
    40.5
    60.38
    80.33
    100.31
  • Step 5 - Sketch the graph. Play close attention as you move closer to the vertical asymptote.
  • The graph should never cross the vertical asymptote.
Graph
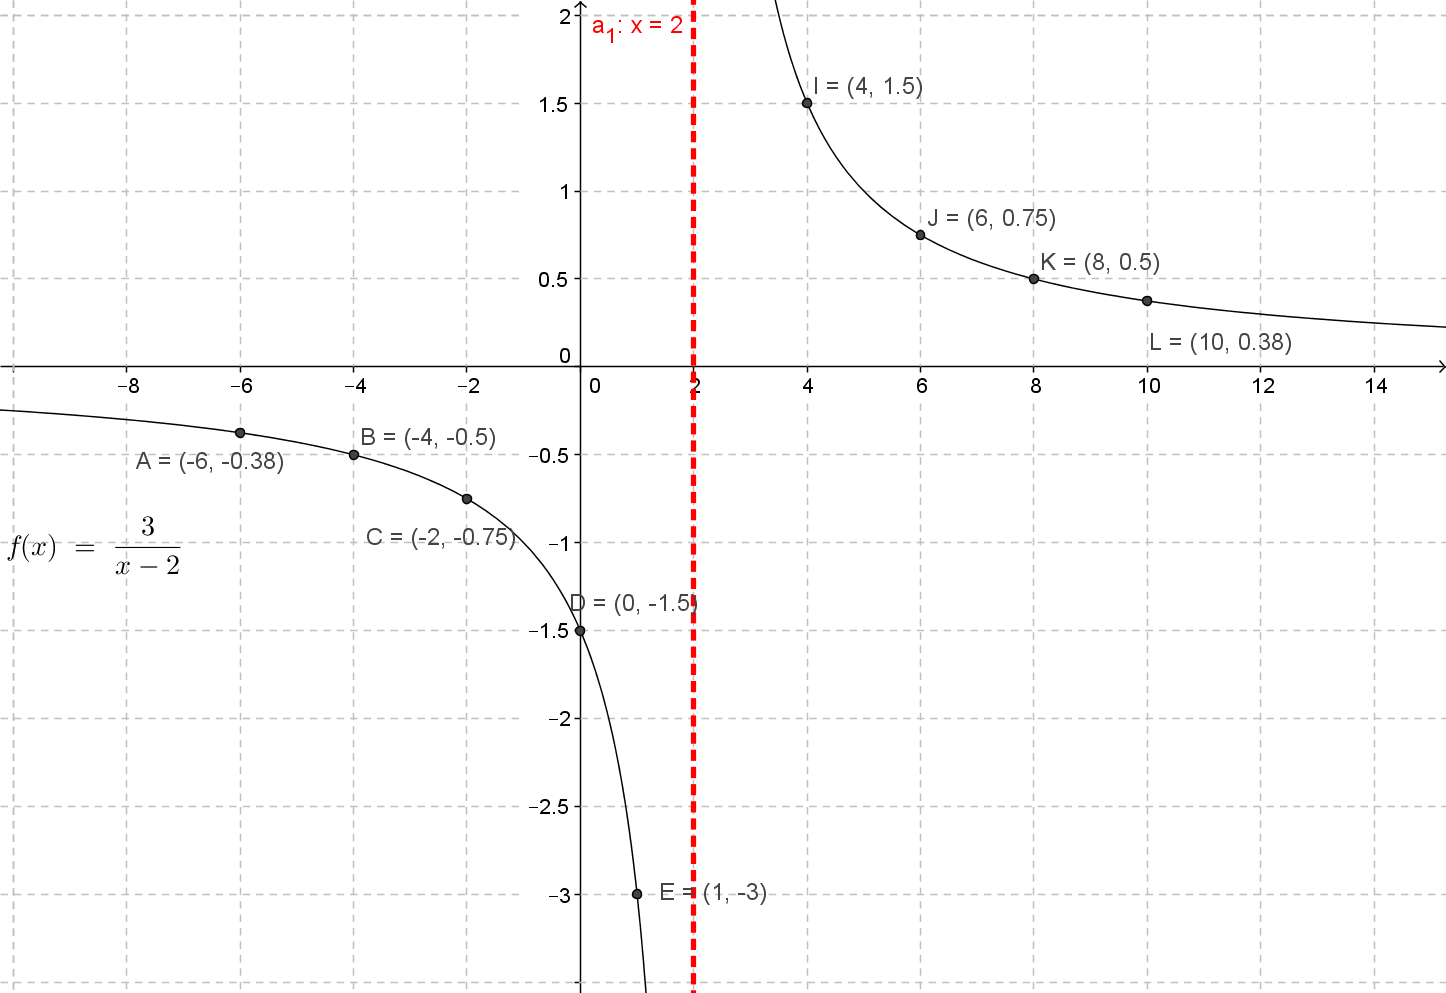
f(x) = [3/(x − 2)]
  • Holes occur when you have a common binomial factor that cancels out.
  • Vertical Asymptotes occur at restricted values in the domain. These are values of x that make the denominator equal to zero.
  • Step 1 - Factor
  • In this case, there is nothing to factor out.
  • Step 2 - Identify holes by identifying common binomial factors. Then eliminate the binomial factors.
  • Notice how there are no holes.
  • Step 3 - Identify vertical asymptotes by setting denominator equal to zero
  • x − 2 = 0
  • x = 2
  • Step 4 - Graph the vertical asymptotes and create a table of values, with values of x to theleft and right of the vertical asymptotes
  • x[3/(x−2)]
    -6-0.38
    -4-0.05
    -2-0.75
    0-1.5
    1-3
    1.75-12
    2.2512
    2.754
    41.4
    60.75
    80.50
    100.38
  • Step 5 - Sketch the graph. Play close attention as you move closer to the vertical asymptote.
  • The graph should never cross the vertical asymptote.
Graph
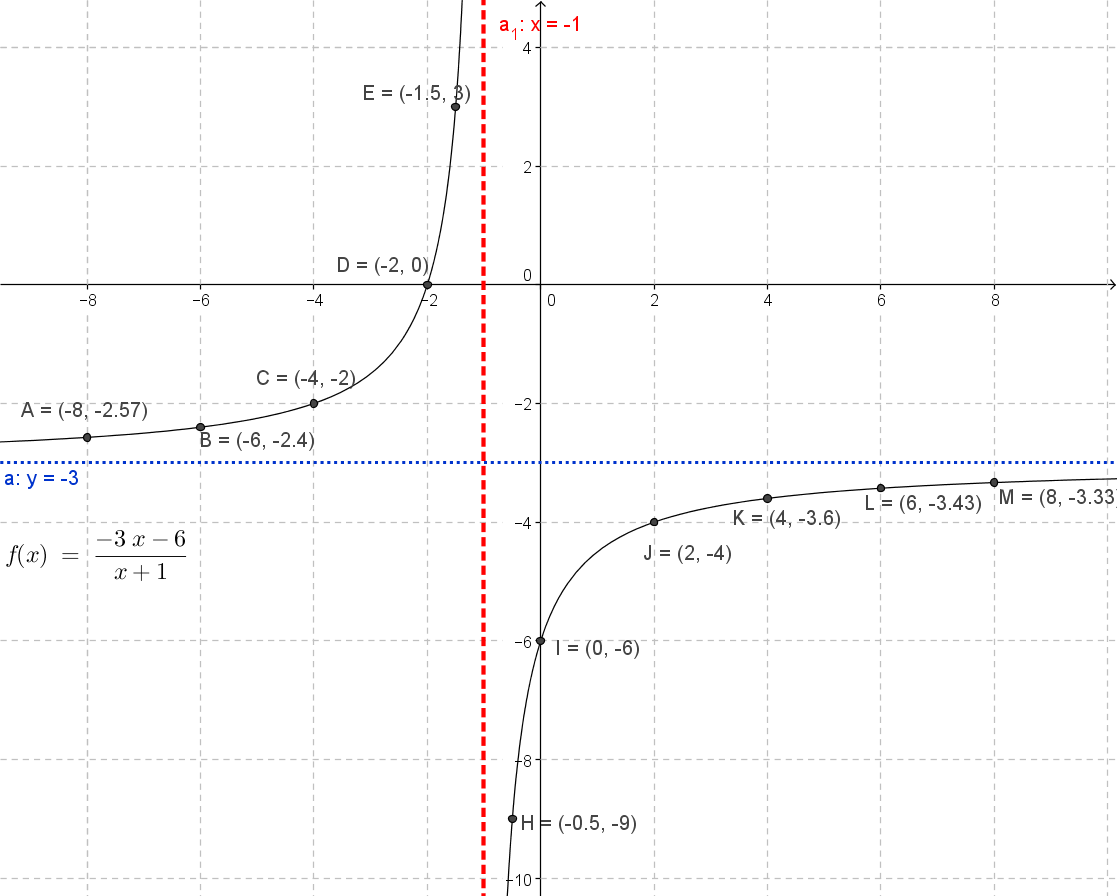
f(x) = [( − 3x − 6)/(x + 1)]
  • Holes occur when you have a common binomial factor that cancels out.
  • Vertical Asymptotes occur at restricted values in the domain. These are values of x that make the denominator equal to zero.
  • Step 1 - Factor
  • f(x) = [( − 3x − 6)/(x + 1)] = [( − 3(x + ))/(x + 1)]
  • f(x) = [( − 3x − 6)/(x + 1)] = [( − 3(x + 2))/(x + 1)]
  • Step 2 - Identify holes by identifying common binomial factors. Then eliminate the binomial factors.
  • Notice how there are no holes.
  • Step 3 - Identify vertical asymptotes by setting denominator equal to zero
  • x + 1 = 0
  • x = − 1
  • Step 4 - Graph the vertical asymptotes and create a table of values, with values of x to theleft and right of the vertical asymptotes
  • xy=[(−3x−6)/(x+1)]
    -8-2.57
    -4-2
    -20
    -1.53
    -1.259
    -0.75-15
    -0.5-9
    0-6
    2-4
    4-3.6
    6-3.43
    8-3.33
  • Step 5 - Sketch the graph. Play close attention as you move closer to the vertical asymptote.
  • The graph should never cross the vertical asymptote.
Graph
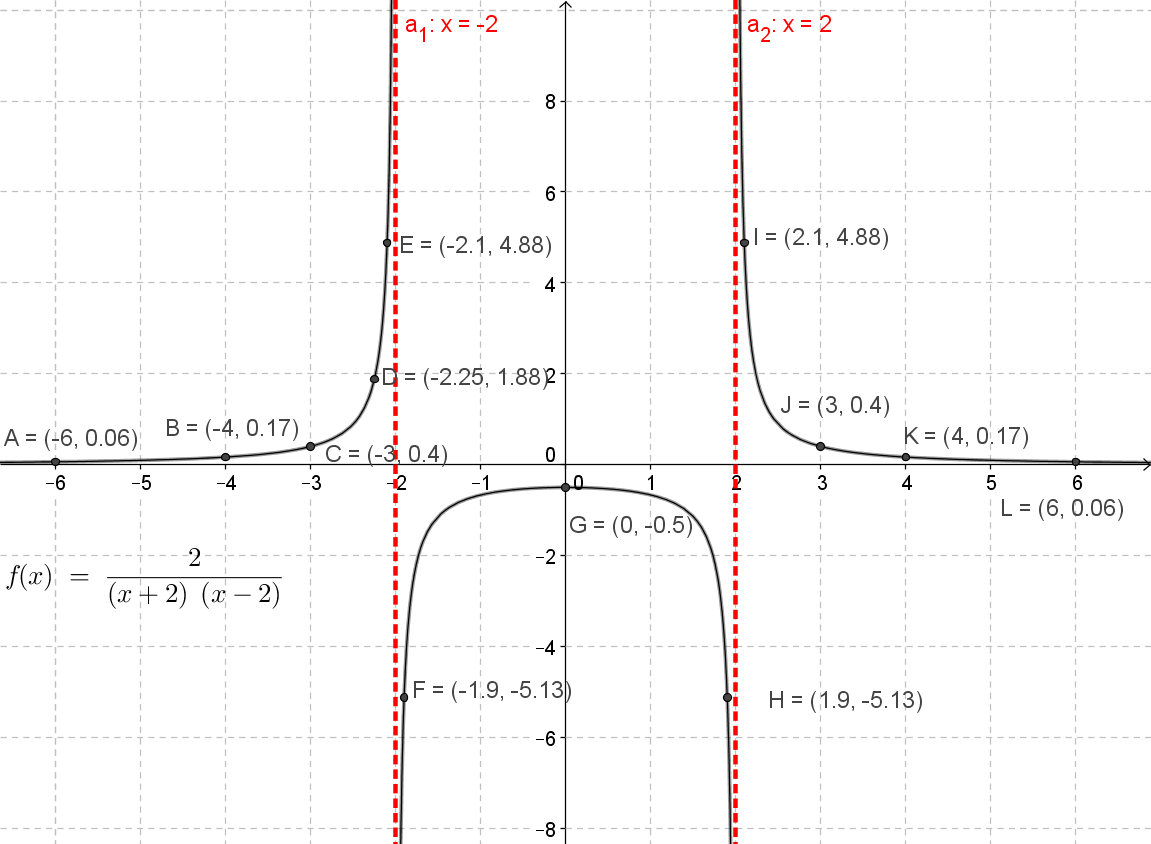
f(x) = [2/(x2 − 4)]
  • Holes occur when you have a common binomial factor that cancels out.
  • Vertical Asymptotes occur at restricted values in the domain. These are values of x that make the denominator equal to zero.
  • Step 1 - Factor
  • f(x) = [2/(x2 − 4)] = [2/(( + )( − ))]
  • f(x) = [2/(x2 − 4)] = [2/((x + 2)(x − 2))]
  • Step 2 - Identify holes by identifying common binomial factors. Then eliminate the binomial factors.
  • Notice how there are no holes.
  • Step 3 - Identify vertical asymptotes by setting denominator equal to zero
  • x + 2 = 0 and x − 2 = 0
  • x = − 2 and x = 2
  • Step 4 - Graph the vertical asymptotes and create a table of values, with values of x to theleft and right of the vertical asymptotes
  • xy=[2/(x2−4)]
    -60.06
    -40.17
    -30.4
    -2.251.88
    -2.14.88
    -1.9-5.13
    0-0.5
    1.9-5.13
    2.14.88
    30.4
    40.17
    60.06
  • Step 5 - Sketch the graph. Play close attention as you move closer to the vertical asymptote.
  • The graph should never cross the vertical asymptote.

*These practice questions are only helpful when you work on them offline on a piece of paper and then use the solution steps function to check your answer.

Answer

Graphing Rational Functions

Lecture Slides are screen-captured images of important points in the lecture. Students can download and print out these lecture slide images to do practice problems as well as take notes while watching the lecture.

  • Intro 0:00
  • Rational Functions 0:18
    • Restriction
    • Example: Rational Function
  • Breaks in Continuity 2:52
    • Example: Continuous Function
    • Discontinuities
    • Example: Excluded Values
  • Graphs and Discontinuities 5:02
    • Common Binomial Factor (Hole)
    • Example: Common Factor
    • Asymptote
    • Example: Vertical Asymptote
  • Horizontal Asymptotes 20:00
    • Example: Horizontal Asymptote
  • Example 1: Holes and Vertical Asymptotes 26:12
  • Example 2: Graph Rational Faction 28:35
  • Example 3: Graph Rational Faction 39:23
  • Example 4: Graph Rational Faction 47:28

Transcription: Graphing Rational Functions

Welcome to Educator.com.0000

We have been working with rational expressions; and now we are going to talk about graphing rational functions.0002

And graphs of rational functions have some features that you may not have seen so far, when you were working with other types of graphs.0008

OK, so first, defining a rational function: a rational function is in the form f(x) = p(x)/q(x),0018

where both p(x) and q(x) are polynomial functions, and q(x) is not equal to 0.0026

As usual, we have the restriction that the denominator cannot be 0.0034

Values that make the function in the denominator equal to 0 are excluded from the domain of this function.0040

For example, f(x) = (x2 + 8x + 15)/(x2 - 2x - 8):0050

we have worked with rational expressions so far, and now we are just talking about these as functions.0063

Working with a function like this, I would look at the denominator and factor that out.0070

This gives me x...and since there is a negative here, it is plus and minus.0079

Factors of 8 are 1 and 8, and 2 and 4; and I am looking for a set of factors that is going to add up to -2.0086

And that would be 2 - 4; so the 4 goes in the negative place, and the 2 in the positive.0097

So, I have factored this out; and the reason is to look for the excluded values, values that would make q(x) negative.0106

I am going to use the zero product property, because if this entire expression is 0,0116

that could occur if either x + 2 = 0 or x - 4 = 0, or they are both equal to 0.0123

Using the zero product property, I have x + 2 = 0 and x - 4 = 0.0130

This becomes x = -2; and this right here is x = 4; therefore, my excluded values are x = -2 and x = 4.0139

So, excluded from the domain of f(x) are x = -2 and x = 4.0151

OK, so now, working with these rational functions, we are just going to do some basic graphing, first introducing the concept of breaks and continuity.0166

We have worked with linear functions; we have worked with polynomial functions, particularly quadratic functions,0176

which are a second-degree polynomial function; and we see that these graphs are always continuous.0183

For example, I may have had a graph of a polynomial like this, or of a quadratic function like this.0190

So, there are no areas of the graph where there are missing pieces, or it stops and then starts again: these graphs are always continuous.0201

Rational functions are different: they may have points at which they are not continuous, and these are called discontinuities.0211

And there are a couple of different types of discontinuities.0219

These discontinuities occur because there are excluded values from the domain.0222

When we worked with, say, a quadratic function, we may have said, "The domain is all real numbers."0228

There are no parts of the graph where the function is not defined.0235

Now, we are going to see a couple of different situations; we are going to see one type of discontinuity0239

that we will discuss in a minute, that is called a hole, where the graph is going along,0247

and then suddenly it is not defined in this certain section.0255

We are also going to see a couple of other, more complicated, types of discontinuities, called asymptotes,0259

where the graph will approach a certain value, but it will not quite reach it.0266

And we will define all that in a second; but there are a couple of types of discontinuities.0271

These would occur at excluded values: for example, f(x) = (x2 + 3x - 1)/(x + 8).0275

Well, x = -8 is an excluded value; therefore, there will be a discontinuity here.0286

And we are going to talk right now about the different types and how to know which type of discontinuity you are dealing with.0295

OK, there are two ways that a graph of a rational function can show discontinuity.0302

If the function in the numerator, p(x), and the function in the denominator, q(x), have a common binomial factor,0308

then the graph has a hole at the point of the discontinuity.0316

Remember that we defined f(x) as consisting of p(x)/q(x).0319

So, if these two have a common factor, then we will see a hole at that point in the graph.0325

For example, let's let f(x) equal (x2 - 9)/(2x - 6).0331

We are going to factor both the numerator and the denominator, because I want to find the excluded values,0342

but I also want to see if there is a common factor.0349

So, this, as usual, factors into (x + 3) (x - 3); in the denominator, there is a common factor of 2, so it factors into (x - 3).0354

Looking here, I have (x - 3) here and (x - 3) here, so let's just focus on that for right now.0368

And I have a common binomial factor, (x - 3); I know that, if (x - 3) equals 0, this will equal 0.0378

And therefore, when x - 3 equals 0, this will be undefined.0402

Well, when x = 3, then I would have 3 here; 3 - 3 is 0; that doesn't work--it is undefined.0410

Therefore, x = 3 is an excluded value, and there is going to be a discontinuity here.0417

There will be a discontinuity at x = 3; and the type of discontinuity is a hole (at x = 3).0425

And the reason it is a hole is because there is a common factor; this is a common binomial factor.0434

If there was an excluded value here, but it wasn't a common factor, we will get a different discontinuity that we will talk about in a second.0440

So, let's just go ahead and find some points and see what this graph is going to look like.0447

Now, I factored this out; I left my factors here, so I could look at it and see that, yes, this is a common factor.0450

But for the purposes of graphing, I am not going to leave this factor here.0459

I want to make my graphing as simple as possible, so let me rewrite that up here: f(x) = (x + 3)(x - 3)/2(x - 3).0463

I have figured out that there is a hole at x = 3; now, I am done with this factor.0476

I am just going to cancel it out so that I can make my graphing and my calculations much simpler,0479

because this is just going to be f(x) = (x + 3)/2.0486

Therefore, as usual when I graph, I can find some points.0491

Let's start out with -5, because -5 + 3 is -2, divided by 2 is -1.0498

-3 + 3 is 0, divided by 2 is 0; -1 + 3 is 2, divided by 2 is 1.0508

Remember that 3 looks fine here, but back in the original I saw that that would make the denominator 0.0520

So, I have to remember that 3 is an excluded value.0528

I can't use this for the domain; I can't find a function value for that--it is undefined.0535

When x is 5, 5 plus 3 is 8, divided by 2 is 4; this is enough for me to go ahead and graph.0543

So, when x is -5, y is -1; when x is -3, y is 0; when x is -1, y is 1; when x is 3, I have an excluded value; I can't do anything with that.0549

I will show you how I will represent it in a second.0567

When x is 5, y is 4.0569

This gives me enough to draw a line; however, when I get to 3, I am just going to leave a circle there, indicating that there is a hole at x = 3.0573

This graph is discontinuous; and there is a discontinuity here at x = 3, since that value is excluded from the domain.0593

OK, so this is our first type of discontinuity--a hole.0602

The second type is called an asymptote.0607

Recall that we said a rational function would be something like f(x) = p(x)/q(x).0614

If there is a common factor between these two, then we get a hole.0624

Now, there may be excluded values that don't involve a common binomial factor.0628

For example, if there is a factor in the denominator ax - b, that the numerator does not have,0634

there, at that point, we will have a vertical asymptote wherever the point is that we solve for x.0643

We took this ax - b and went ahead and solved for x to find this excluded value.0651

That is where we are going to have a vertical asymptote.0657

An asymptote is a line that the graph approaches, but it never crosses.0660

And these can be either horizontal lines or vertical; and we are focusing on vertical lines right now.0664

For example, let f(x) equal x/(x - 2).0669

Here is a factor in the denominator, (x - 2), a binomial factor that is not present in the numerator.0675

So, it is not a hole; instead, there is going to be a vertical asymptote.0681

My excluded value is going to be x = 2, because x - 2 cannot equal 0.0686

If it does, this would be undefined; so x = 2 is excluded from the domain, and there is a vertical asymptote here.0694

When you find the asymptote, the first thing you should do is actually go ahead and put a vertical line at that point,0711

because otherwise you risk a situation where you might accidentally cross it.0722

So, I know that there is a vertical asymptote at x = 2, so I am just going to go ahead and draw a dotted line here,0730

which is going to tell me that my graph can approach this line, but it cannot cross it.0737

In order to know what is going on, what you want to do is look at points on either side of 2,0744

and figure out what the graph does as x approaches 2, as it is very close to 2 from the left,0751

as it is 1.999, and as it is very close from the right--as it is 2.01--right around here, in addition to other points.0759

Let's just start out with some points, say, over here at -2.0768

When x is -2, then we are going to get...-2 and -2 is -4, so -2/-4 is going to give me positive 1/2.0782

OK, so when x is -1, that is going to be -1/-3; that is going to be positive 1/3.0794

When x is 0, that is going to be 0 divided by (0 - 2); well, 0 divided by anything is 0.0803

When x is 1, 1 divided by 1 - 2 is going to be 1 divided by -1, so that is going to be -1.0811

So, I know that x is never going to equal 2; so I can't just say, "OK, the next point I am going to find is x = 2."0836

I am going to find points close to it--x-values very close to it, but not actually equal to 2.0846

So, let's start from this left side and think about what happens when, say, x is 1.9.0855

Well, when x is 1.9, then that is going to give me 1.9 - 2, so that is going to give me -.1.0866

So, if I just do 1.9 divided by .1 and move the decimals over, that is going to give me -19; I'll put that right here.0877

OK, so now, let's think about x getting even closer to 2: let's let x be 1.99.0887

So, it is approaching 2 from this left side: that is going to give me 1.99; 1.99 - 2 is going to be -.01; so that is going to give me -199.0896

And you can continue on, and you will see the pattern that, as x approaches 2 from the left side, the y-values become very large negative numbers.0916

OK, so I am doing a little bit of graphing: let's get some points and just think about what this is going to look like, coming at it from this side.0929

Let's graph out some points: when x is -2, y is 1/2; when x is -1, y is 1/3; when x is 0, y is 0; 1, -1.0943

OK, now when x gets close here, this is going to be way down here, so I can't represent it exactly.0957

But what I do know is that, the closer this x is getting, the more and more large of a negative number y is.0966

So, I have the general shape here that...what is happening is: this is approaching the asymptote, but it is not going to cross it.0974

I see that there is a discontinuity right here, because x can never quite reach 2; and so, the graph is not ever going to reach this line.0991

OK, now, this is part of the graph: this is what happens when x approaches 2 from the left.1008

I also want to figure out what happens when x approaches 2 from the right.1015

So, let's look at some values that are just a little bit greater than 2, such as 2.1.1020

OK, so when x is 2.1, 2.1 - 2 is going to be .1, so that is going to be 21.1028

Now, getting a little bit closer: 2.1, say, is right here--let's get a little bit closer: let's make this 2.01.1040

That is going to give me 2.01 divided by .01, or 201.1050

OK, getting even closer, let's make x 2.001; so I am coming at this from this side--it is 2.001, divided by .001, which is going to give me 2001.1056

And then (that is right in here), I am going to graph some more points out here,1073

just so I have more of the shape of the graph, beyond just this little area.1076

OK, let's let x equal 4; 4 divided by 4 - 2 (4 divided by 2) is 2, and also 3: 3 divided by 3 - 2 (that is 3 divided by 1) is 3.1082

First, out here, I have 3, 4; so when x is 4, y is 2; when x is 3, y is 3.1098

Now, the closer I get to this...at 2.1, y is going to be way up here at 21; as I get even closer, y is going to be even bigger.1114

So, what is happening with this graph is: as the values of x approach 2, y becomes very large.1123

And this graph is going to approach this line, but it is not going to cross it.1136

So, a couple of things that we notice: one is that, as x approaches 2 from the left, the values for y become very large in the negative direction.1145

I am closer and closer and closer to 2, but never reaching it.1157

I jump to the other side of 2: 2.1--y is 21--it is large; 2.01--a little closer to x--y becomes 201; even closer at 2.001--a very large value for y.1161

So, this is what the graph is going to look like, because there is a vertical asymptote right here at x = 2.1176

And what you will see is that the graph is going to approach from this side and not quite reach that value;1184

and it is going to approach from this side and not quite reach the value.1189

So, there is a discontinuity at the vertical line x = 2.1192

There are also horizontal asymptotes: the graph of a rational function can have both vertical asymptotes and horizontal asymptotes.1201

And these asymptotes occur at values that are excluded from the range of f(x).1213

So, this is going to be a line; that is horizontal line defined by a value y = something.1218

So, let's look at this function: g(x) = (x + 1)/2x.1225

I am just going to focus on the horizontal asymptote; and the important thing is that horizontal asymptotes1232

tell us what is happening at very large values of x and very, very small values of x--1241

large positive values, or values way over here that are very negative.1247

So, I am not going to worry about the middle of the graph right now; I am just going to focus on what is happening at the extremes of the domain.1251

Let's let x equal, first, a very large number: 100.1259

That is going to give me 101/200; and if you were to figure that out (you may end up using your calculator--that is fine) that will give you .505.1266

OK, so let's make x even bigger; let's make it 1000, because I am trying to figure out what is happening at the extreme right side of the graph.1277

This is going to give me...this was x = 100; so if x = 1000, I am going to get 1001/2000, and if you figure that out, it is going to come out to .5005.1286

When x is 10,000, you are going to end up with .50005; if x is 100,000, it is .500005.1309

What you can see happening is that, as x becomes very large, y is approaching .5, but it is never quite getting there.1328

What that tells me is that there is a horizontal asymptote at y = .5.1338

So, I am just going to go ahead and call this .5, and put my horizontal asymptote right there, and do a sketch of the rest of the graph.1348

This is going to be .5, and there is a line here at y = .5.1357

And what I see happening is that...let's make this 100, and jump up to 1,000, and then 10,000, and then 100,000;1364

of course, if this were proportional, it would be much longer, but this gives you the general idea1375

that when x is 100, it is pretty close; then I get up to x is 1000; y is .5005--it gets closer;1379

10,000--y approaches this line; 100,000--it is approaching it even closer.1392

So, what is happening (actually, it is approaching it from above): when x is 100, we are going to be slightly above .5, at .505.1398

When x is 1000, now it is at .5005, just a little bit above .5; 10,000--barely above it; 100,000; and so on.1412

So, at very large values of x, the graph approaches y = .5, but it doesn't quite reach it.1425

Therefore, y = .5 is a horizontal asymptote.1437

Let's look at what is happening at values of x that are very negative--large negative values of x.1447

Let's look at -100: and again, you may need to use a calculator to calculate this out,1459

to give you the idea: x = -100; therefore, this is going to give me -99/-200.1465

Calculating that out, it comes out to .495.1475

When x equals -1000, this is going to give me -999, divided by -2000.1479

And then, I divide that; I am going to get a positive number, .4995.1487

And continuing on my calculations with -10,000, this would give me .49995, and so on.1495

So, you can see what happens: as x is very negative, y approaches .5, but it doesn't quite reach it.1504

So, if I made this -100, -1000, -10,000, and so on, I see that, at -100, this is pretty close;1512

it is y = .495; but then I get to a bigger number, like -1000; it is even closer at .4995.1523

A bigger number is even closer; so I can see that, on this side, as x becomes very negative, y is approaching .5 from below.1532

So here, at very large values of x, the graph approaches .5 from above; at very small values of x, the graph approaches .5 from below.1543

It is the same idea as a vertical asymptote, with the approaching, but never crossing that line.1553

Horizontal asymptotes tell you what is happening at the extremes of the domain--extremely large values and extremely small values.1559

This first example just asks us to describe any holes and vertical asymptotes that this function would have.1574

We don't need to actually graph it out.1580

So remember: to find those, you are going to have to factor and look at excluded values.1582

The denominator is already factored for us.1588

All right, in the numerator, I have a negative here, so plus and minus.1597

I have factors of 12: 1 and 12, 2 and 6, 3 and 4; and I see that I have +1: I need these factors to add up to 1.1602

So, I am going to look for factors close together: 3 and 4.1616

Since this is positive, I am going to make the 4 positive: 4 - 3 is going to give me 1.1620

So, I am going to factor this out to (x + 4) (x - 3).1625

Now, recall that a hole will occur when you have a common binomial factor.1631

And I do have that: (x + 4) is a common binomial factor.1637

So, I am going to go ahead and look at the excluded values that I have: using the zero product property, I have (x + 4) (x - 7) = 0.1640

And this would be a situation that is not allowed: so I need to find out what values of x would create this situation.1652

x + 4 = 0 and x - 7 = 0: either of those will cause this whole thing to become 0.1658

So, x = -4 and x = 7 are excluded values; they are excluded from the domain.1666

Now, since (x + 4) is a common binomial factor in the numerator and denominator, there is going to be a hole at x = -4.1676

x = 7 is also an excluded value; however, there is not a common factor.1688

So, it is simply going to be a vertical asymptote at x = 7.1701

There is a hole, where there is a common factor, for the value of x that would create a zero down here, which is x = 4,1713

and a vertical asymptote at the other excluded value of x = 7.1721

And if you were to graph that, you would start out by finding these, so that you would be aware of that for your graph.1726

So now, we are asked to graph this rational function; and as always, I am going to start out by looking for holes and vertical asymptotes.1737

I am going to factor the denominator; and this gives me...since I have a negative here, I have (x + something) (x - something).1750

The only integer factors of 5 are 1 and 5, and I know that if I add + 1 and negative...1759

Actually, we are looking at 6, so it is 1 and 6, 2 and 3.1769

And I am looking for factors that will add up to -5; and I look at 6 and 1.1774

If I took 1 - 6, that is -5; so this is going to factor out to (x + 1) (x - 6).1780

(x + 1) times (x - 6) is not allowed to equal 0; if it does, then this is undefined.1793

So, excluded values are going to be values of x that cause this product to be 0.1799

Using the zero product property, I get these two equations, and I find that x = -1 and x = 6 are excluded from the domain.1804

Since x + 1 is a common factor in the numerator and denominator, there is going to be a hole at x = 1.1818

And there is going to be a vertical asymptote at x = 6.1828

Put in the vertical asymptote represented by a dashed line, so that I know that my graph will approach, but it will not cross.1841

And then, I also have to remember that wherever the graph ends up, x = -1 is going to be excluded.1851

So, I will put an open circle there to denote that.1859

I am just starting out with some values, and especially focusing on values as x gets very close to 6,1865

either from the left (5.99999) or from the right (6.0001), thinking about what happens right around this asymptote.1873

Let's just start out with some values that aren't quite that close; but say x is -2.1885

Now, in order to make my life simpler, I am actually going to, now that I have looked at these factors...1893

I don't need that factor anymore, so I can cancel this out.1899

And I am just going to end up with 1/(x - 6), because remember, this really means 1 times (x + 1).1902

So, I am canceling this out, and I get 1/(x - 6)--much easier to work with for the graph.1910

When x is -2, that is going to give me 1/(-1/8); when x is -1, I can't forget that this is not defined.1916

I don't have a value for when x is -1; this function is just not defined.1928

When x is 0, that is going to give me 1/-6; so that is -1/6.1937

Now, let's think about what happens as we get closer to 6: let's let x be 5.1946

That is 1/(5 - 6), so that is 1/1; that is 1.1953

I am starting to graph a few of these points: when x is -2, y is -1/8, just right down here.1960

When x is -1, y is not defined; when x is 0, this is going to be -1/6.1976

When x is 5, y is going to be 1; so the general shape is going to be like this, so far.1986

But I am going to make sure, here at -1, that I show that there is a hole at x = -1.1994

Now, I want to figure out what is going on right here, so I am going to pick some values even closer to 6.2007

I am going to pick 5.9: well, if x is 5.9, that is going to give me 1/(5.9 - 6); that is going to be 1/-.1, so that is going to give me -10.2012

I want to get even closer to 6, so let's try 5.9.2034

Now, when I have x = 5.99, this is going to give me 1/(5.99 - 6), which is -.01; so this is going to give me -100.2047

So, what you can see is happening is that, as x approaches 6 (this is actually supposed to be -1)...here we had y as -1 when x is 5.2068

Then, x is 5.9, which is closer to 6; x becomes -2, 4, 6, 8, 10; so it is way down here.2086

Now, even closer to 6: 5.99--y becomes a very large negative value, -100.2097

So, I can see that what is happening is that this graph is going to approach this line, but it is never going to reach it; it is never going to cross it.2105

Something else I also need to look at is what is happening to the graph as x approaches 6 from the other side.2128

Let's look at values just on the other side of 6: let's look at 6.1.2137

And if you work this out, you will see that, when x is 6.1, y is 10.2145

When x is 6.01 (when x is 6.1, I am going to see that x is 2, 4, 6, 8, 10; y is way up here)--if I got even closer to 6--2153

I made x 6.01--y is going to become 100.2170

So, I already see this usual trend of approaching, but not crossing, the vertical asymptote.2175

So, as x approaches 6 from the right side, y becomes very large.2183

As x approaches 6 from the left side, y becomes very, very large negative numbers.2190

To get a better sense of the graph, let's also look at some numbers over here.2197

7 would be right about there; so when x is 7, that is 1/(7 - 6), so that would be 1; when x is 7, y is 1.2201

When x is, let's say, 10, that is going to give me 1/(10 - 6); that is 1/4.2212

When x is 7, y is going to be 1; when x is 10, it is going to be right here; it is just going to be like this.2220

So, the other thing that you notice as you plot more points: let's plot a very large value of x.2232

Let's plot 100: so this is 1/(100 - 6), so that is 1/96, and that is going to give me .01.2246

Something else that you are noticing here on the graph, as you plot more points, is that,2255

in addition to this vertical asymptote, there is also a horizontal asymptote at y = 0.2260

And you can see that, as x gets larger, the graph approaches 0, but it doesn't quite reach 0.2279

And if you plotted additional large points, you would see that, as well--that it never quite reaches 0.2291

If you plotted additional points of x that were very, very small--very negative--you would see the same thing:2298

that the graph is going to approach values of the function that equal 0, but it is never going to quite get there.2303

Reviewing what we found about this graph: we found that there is going to be a hole at x = -1, designated by an open circle.2313

There is a vertical asymptote at x = 6; that is an excluded value, x = 6.2321

So, x is never going to equal 6; and as x approaches 6, y becomes very, very large or very, very small, as it gets near that graph.2332

But it is never going to cross the graph: x will never equal 6, so the graph will never cross that line.2344

We also see that there is a horizontal asymptote--that, for very large negative or large positive values of x,2349

the graph is going to approach this line, but it is never going to cross it.2356

OK, in this example, we are going to be graphing f(x) = x/(x + 3).2362

So, the first thing is to figure out excluded values: x + 3 cannot equal 0, so I am going to look for what value of x would cause this to become 0.2369

And that would be x = -3; and that is excluded.2383

And since there is not a common binomial factor, there is going to be a vertical asymptote here.2386

So, I am just going to start out by marking that, so we don't lose track of that.2394

There are no holes, because there are no common binomial factors.2400

Just to get a sense of the graph, I am going to start out by plotting some points here, approaching x = -3.2404

And then, I am going to go to the other side and do the same thing.2414

Let's start over on this side, with values such as -2.2420

When x is -2, if you figure this out, it comes out to say that y is also -2.2424

When x is -1, we are going to get y equaling -1/2.2432

When x is 1, 1 over 4 would give me 1/4; when x is 0, then I am going to get 0 divided by something, which is 0.2440

Now, of course, I am not going to use -3 as a value, because that is an excluded value.2453

Let's go ahead and plot these: this is -2 and -2; -1 and -1/2; 0 and 0; and 1 and 1/4.2461

So, I can already see what this graph is approaching here.2478

What happens when x gets very close to -3, a little bit to the right of it (values like -2.9)?2481

It is coming at it from this way: -2.9; -2.99; -2.999; what happens there?2493

Well, when x is -2.9, if you figure this out, you will see x = -2.9; that is going to give -2.9/(-2.9 + 3); that is going to be .1; that is going to give me -29.2499

So, as x approaches -3, y becomes very large in the negative direction.2522

And just to verify that, taking another point, -2.99 is going to give me -2.99/.01, equals -299.2529

So, that is enough to give me the trend of what is happening--that this graph is curving like this.2545

And at values very close to -3, a little bit larger than -3 (a little bit less negative), y becomes very large in the negative direction.2553

OK, now I am going to jump over to the other side of this asymptote and figure out what is going on at values over here on the left:2569

-5, -4, and then things like -3.01 or -3.001--very close on this left side.2576

Let's make a separate column for that and start out with something such as -5.2585

When x equals -5, that is going to give me -5/(-5 + 3), so that is -2, so that is 5/2, or 2 and 1/2.2596

At -4, that is going to give me -4/(-4 + 3), so -4/-1; -4/-1 is just going to be 4.2612

That is over here; now, that is -5; 5/2 is right here; -4 is 4; OK.2626

Now, what is going to happen, then, since the graph is moving up this way--what is going to happen very close to -3?2641

I can already predict that y is likely going to get very large, and approach, but not cross, the graph.2650

But let's go ahead and verify that.2656

Values close to -3, but just left of it, would be something like -3.1.2659

And if you work that out, you will see that that comes out to 31.2667

If you pick a value that is even closer to -3, like -3.01, you will get 301.2672

If I go even closer, -3.001, I will get 3001.2685

So, over here, as the graph approaches from the left, y becomes very, very negative--has very large negative values.2691

As the graph approaches x = -3 from the right, the values of x become very large.2700

Now, the one other thing we want to look at is, "Are there any horizontal asymptotes?"2710

And I can notice here that my graph is sort of flattening out when I get near 1.2716

So, I have some values over here, -2, -1...but I want to look at much larger values of x, just to see what is happening.2722

For example, now I am looking for what is going on at the extreme values of x, when the domain is large, or for domain values that are very small.2737

When x is 100, what I am going to get is 100 divided by 103, which is .97.2747

Let's make x even bigger: so, if x is 1000, I am going to get 1000 divided by 1003, which is .997.2755

And you can already see that, as x gets very large, y is approaching 1; but it is not actually reaching it.2764

What this is telling me is that I have a horizontal asymptote right here: y = 1--horizontal asymptote.2774

To verify that: what I expect to happen is that, on this side, the graph is also going to approach y = 1, but it is not going to cross it.2788

So, let's look at what happens at very negative values of x, just picking a value like -1000.2797

So, that is going to give me -1000/(-997); and calculating that out, you would get 1.003.2805

So again, I see that, at very large negative values of x, this graph is coming in close to 1, but it is not quite reaching it.2818

OK, so to sum up: this graph has two branches to it, and it has a vertical asymptote at x = -3; it has a horizontal asymptote at y = 1.2829

We see the graph approaching both of those asymptotes, but not crossing them.2842

This function starts out looking pretty complicated; so let's factor it and see what we have.2849

All right, so my leading coefficient is 2, so I have a 2 right here and an x here.2858

I have a negative here, so I am going to have one negative and one positive; but I need to figure out which way is correct.2863

Factors of 3 are just 1 and 3; and I have 2x and x; let's try some combinations.2870

If I put 2x - 1 here and x + 3 there, what do I get?2880

Well, I get 2x2, and then I get 6x - x - 3; 6x and -x is 5x, so this is the correct factorization, (2x - 1) (x + 3).2886

In the denominator, I have a leading coefficient of 1, so that makes it easier; and I have a negative here: +, -.2908

Factors of 15 are 1 and 15, 3 and 5; and I want factors that are going to add up to -2.2918

So, 3 - 5 equals -2, so this is the correct factorization.2928

What you will see, then, is excluded values: (x + 3) (x - 5)--I cannot allow this to equal zero.2937

So, using the zero product property, I know that, if x + 3 equals 0, or x - 5 = 0, then this whole thing will end up being zero.2946

Solving for x: there are excluded values at x = -3 and x = 5--these are excluded.2958

However, since (x + 3) is a common binomial factor, I have a hole here: x = -3--there is a hole right here.2967

x = 5: since (x - 5) is not a common factor of the numerator, then what I have here is a vertical asymptote at x = 5.2980

2, 4, 6...x = 5 is going to be here; let's draw in our vertical line.2995

The graph is going to approach this line from either side, but it is not going to cross it, because x can never equal 5.3010

And I can't forget that, at x = -3, there is going to be a hole; but I don't know where the graph is going to cross yet, so I can't draw that in.3018

OK, I am going to start out finding some values, just to get a sense of the graph.3028

And then, I am going to hone in on this region.3033

When x is 8, let's figure out why: to make my graphing easier, I am going to cancel out common factors,3036

because now I have done what I need to do with those factors.3046

I am going to cancel out that common factor of (x + 3); and what I am going to graph is (2x - 1)/(x + 3).3049

Now, when x is 8, if you plugged that in and figured it out, you would find that y is 5.3057

So, when x is 8, y is 5; getting closer to 5, but not quite reaching it, let's try 4.9.3066

Again, if you were to plug that in and do the math, the calculations, you would find that y then becomes...3082

actually, just to the right...let's do slightly different values.3095

We are looking just to the right of 5, so we are going to look at values that are larger than 5, values such as 5.1.3098

So, we will work on the left in a minute.3106

We have this point here; now we are looking just greater than 5, at things like 5.1.3107

If we let x equal 5.1, we would find that y equals 92.3114

So, as I get very close to x, y is going to get very large.3120

Let's try honing in even closer: when x is something like 5.01, then y gets even larger at 902.3126

And if I continued on, I would find that this gets even larger and larger, as I add 5.001...I am going to get even larger values.3136

x is almost 5, and then y becomes a very large value.3147

So, that is what it looks like, right there.3152

Now, way out to the right, what does it look like--what is the value of the function when x is very large?3157

Looking at something like when x is 100, calculating that out, you would find that y is 2.09.3167

OK, then let's make x even larger: x is 1000: let's figure out what y is going to be.3176

Well, y comes out to 2.009; again, you can see what is happening.3187

As x becomes very large, y is approaching 2, but it is not going to get there.3195

So, we know that what we have is a horizontal asymptote at y = 2.3202

because as x gets larger and larger, it is going to approach, but it will not cross.3209

All right, so I covered what is going on over here to the right of this asymptote; I also determined that I have a horizontal asymptote at y = 2.3222

And let's go over to the left, to values less than x = 5, and find out what is happening.3230

First, I am just picking values right on this side of 5--values such as 4.9.3237

Plug in 4.9 here, and you will find that y is -88.3249

So, when x is just slightly less than 5, y is going to be a very negative value down here.3254

As x gets even closer to 5, letting x be something like 4.99, y is going to become even larger, but in that negative direction.3263

Or 4.999--now we are very close here to x = 5, and y is getting very large; but it is not quite reaching.3276

And that is what we expected.3290

Now, I can also just take some other points to get a more accurate graph.3294

Let's let x equal 0; if x equals 0, then I am going to get 0 - 1 (that is -1), over 0 + 3; so this is going to be -1/3.3302

Now, I have a better sense of where to draw this line.3314

And what I also know is that this part of the graph is going to approach this horizontal asymptote, but it is not going to reach it.3325

And I could verify that by finding some very negative values of x, such as -100.3339

And when x is -100, y is .98.3345

So, I can verify that, the bigger I make x...it is going to approach this asymptote, but it is never going to quite reach it.3356

So again, the pertinent points are a vertical asymptote at x = 5, and something else we talked about:3365

at -3, there is a hole, so I have to draw that in; so here x is -3, so I can't have a value here.3373

I have to just draw a circle, because the graph is actually undefined right there.3382

Let's see, there is a vertical asymptote here, a horizontal asymptote here, and a graph approaching3390

both the horizontal and vertical asymptotes, but never actually reaching it.3409

And the same over here on this side; and make sure that you denote that the graph is undefined--3414

the function is undefined--at the excluded value of x = -3.3423

That concludes this section of Educator.com on graphing rational functions.3428

Educator®

Please sign in to participate in this lecture discussion.

Resetting Your Password?
OR

Start Learning Now

Our free lessons will get you started (Adobe Flash® required).
Get immediate access to our entire library.

Membership Overview

  • Available 24/7. Unlimited Access to Our Entire Library.
  • Search and jump to exactly what you want to learn.
  • *Ask questions and get answers from the community and our teachers!
  • Practice questions with step-by-step solutions.
  • Download lecture slides for taking notes.
  • Track your course viewing progress.
  • Accessible anytime, anywhere with our Android and iOS apps.